🌍 Public
Scatter Plot for Apogee and Perogee
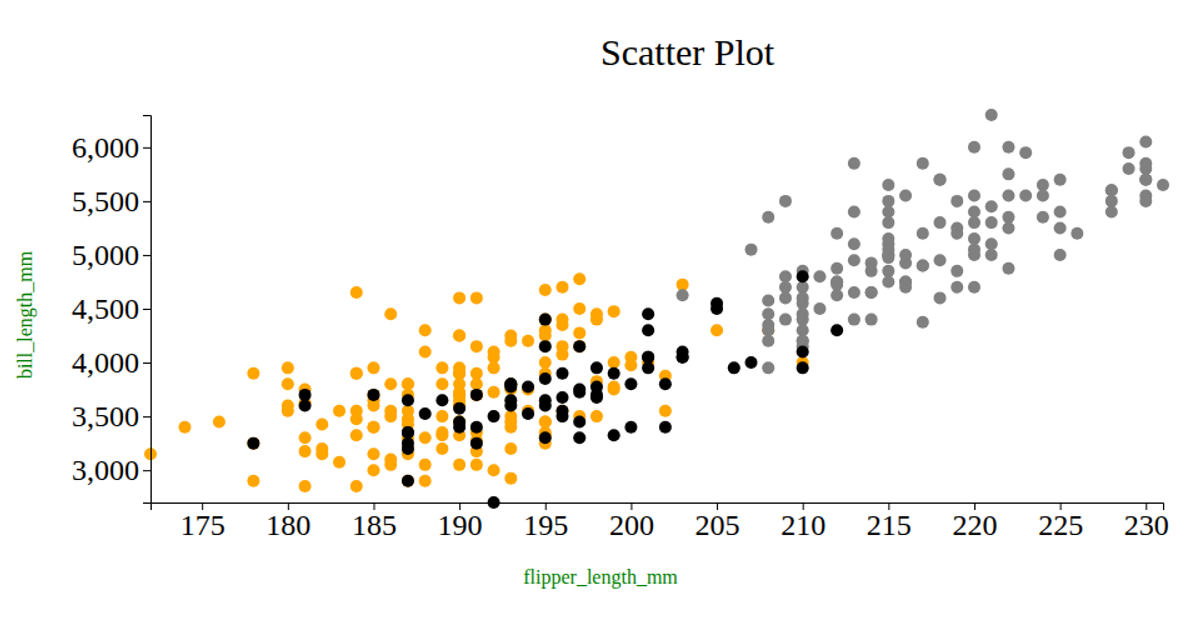
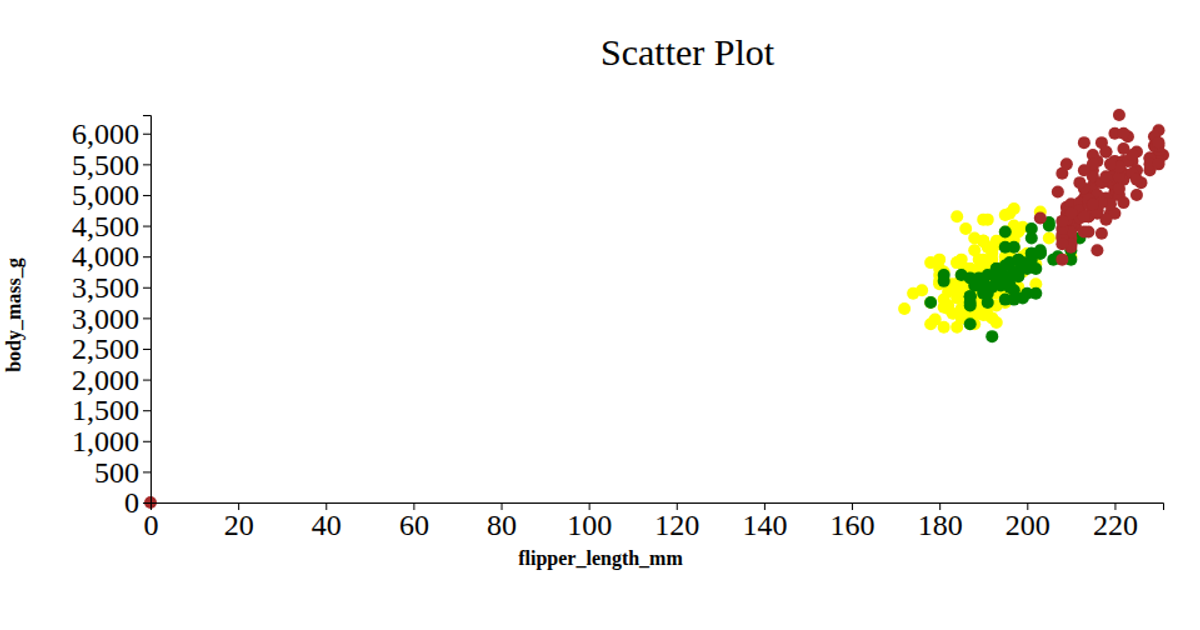
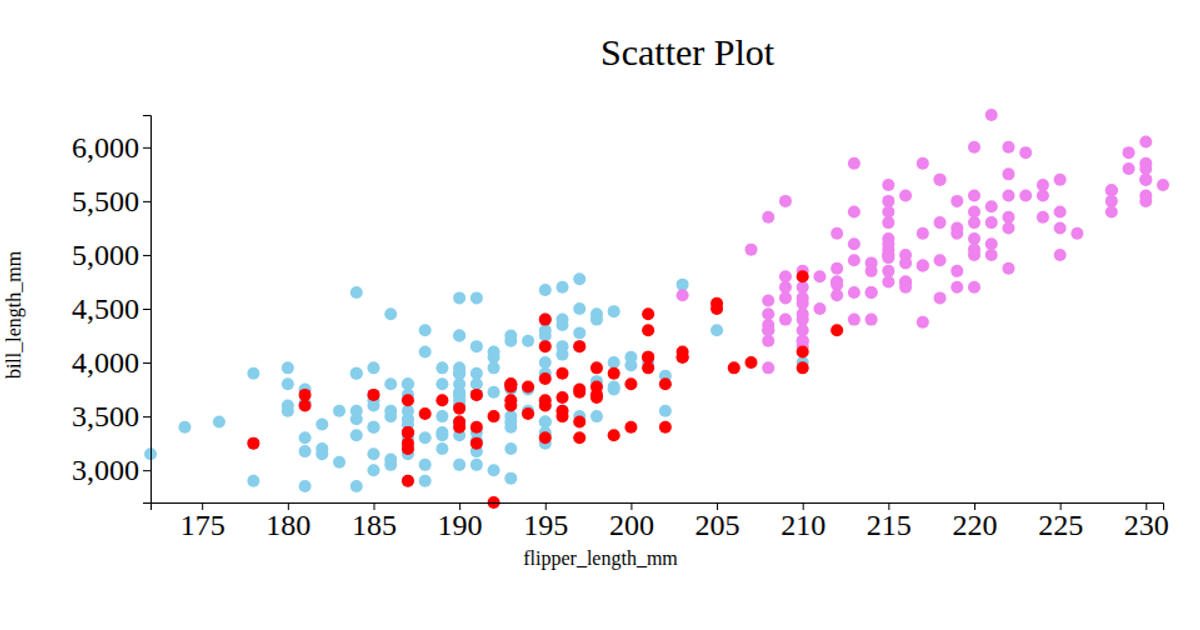
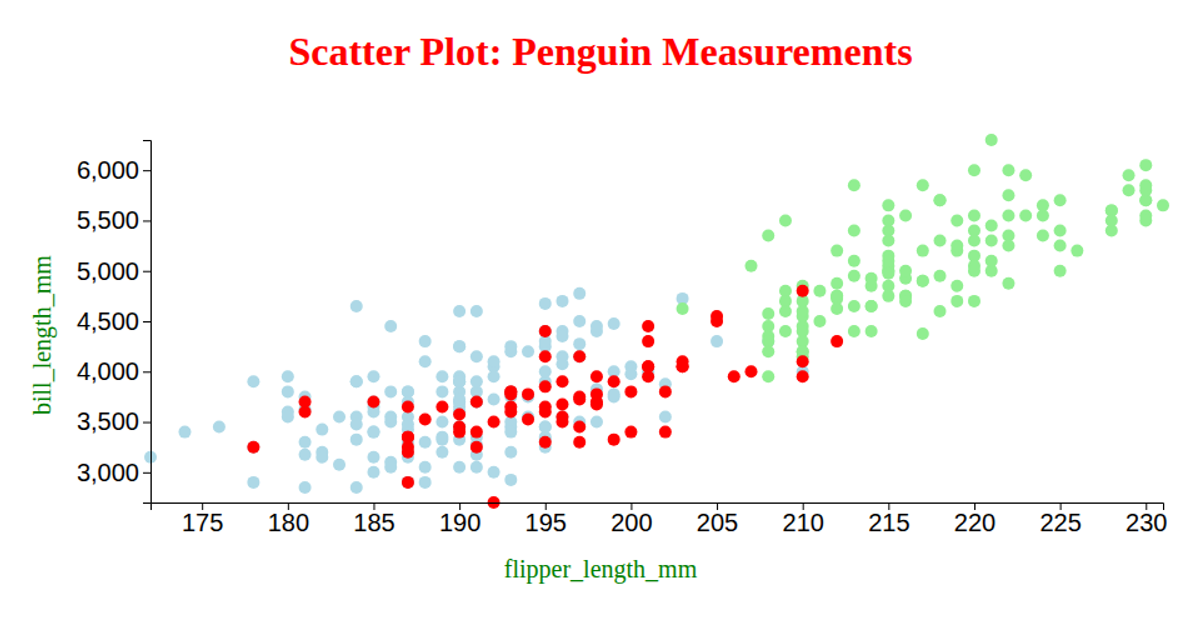
This scatter plot visualizes the relationship between Apogee and Perigee distances for different penguin species, with each circle colored by species (yellow, green, or brown). The x-axis maps Perigee_km while the y-axis maps Apogee_km, and the circle radii are scaled by the same values. Built with D3 v5 and React, it uses `d3.csv` to load data from a GitHub gist, `scaleLinear` for axes, and SVG circles for rendering. Axis labels and a title are added using D3’s `svg.append` methods.
AI-generated descriptionA bare minimum HTML page demonstrating use of CSS and JavaScript.
See also React Starter.
MIT Licensed




Comments
Sign in to join the discussion.