🌍 Public
Francesca Religion Project
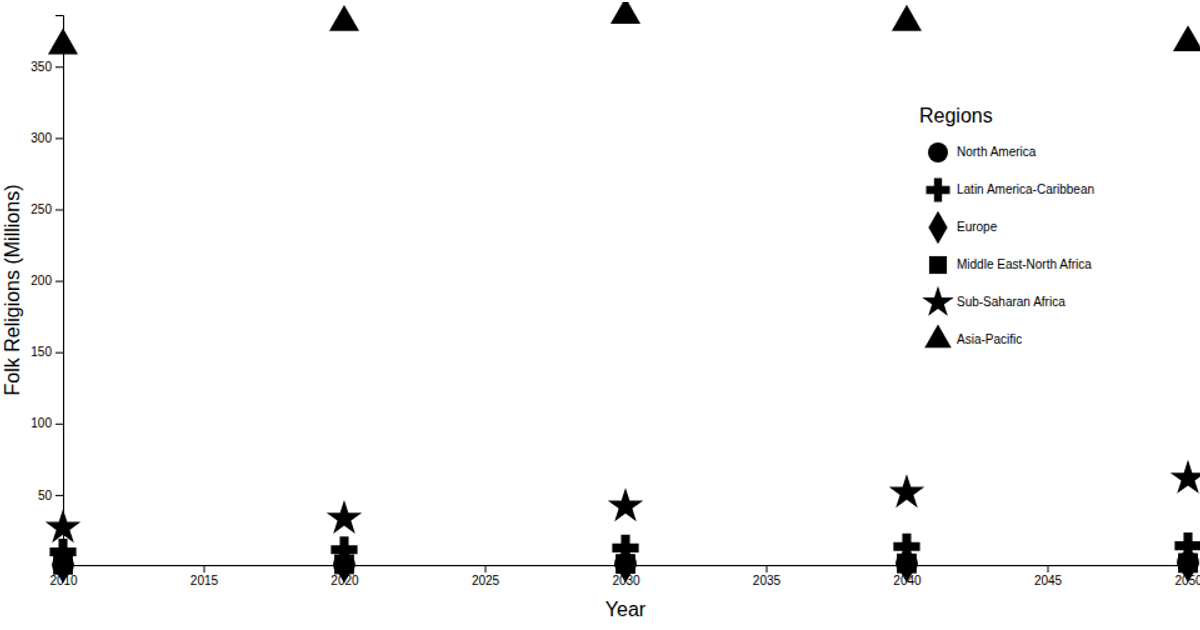
This visualization shows projected growth in religious populations across countries, displaying a line chart of Muslim population data from 2010 to 2050 for Afghanistan, based on data from the Global Monitoring Laboratory’s Trends in Atmospheric Carbon Dioxide. The chart is built with d3.v7, using `scaleTime`, `scaleLinear`, and `d3.line` to render the path, while `d3.csvParse` and `timeParse` handle data loading and date formatting. Axes are generated via `axisLeft` and `axisBottom`, with labels for year and population values.
AI-generated descriptionA reproduction of the Keeling Curve.
Data downloaded from Global Monitoring Laboratory: Trends in Atmospheric Carbon Dioxide.
Uses:
MIT Licensed




Comments
Sign in to join the discussion.