🌍 Public
Fork of Netflix IMDB Scores
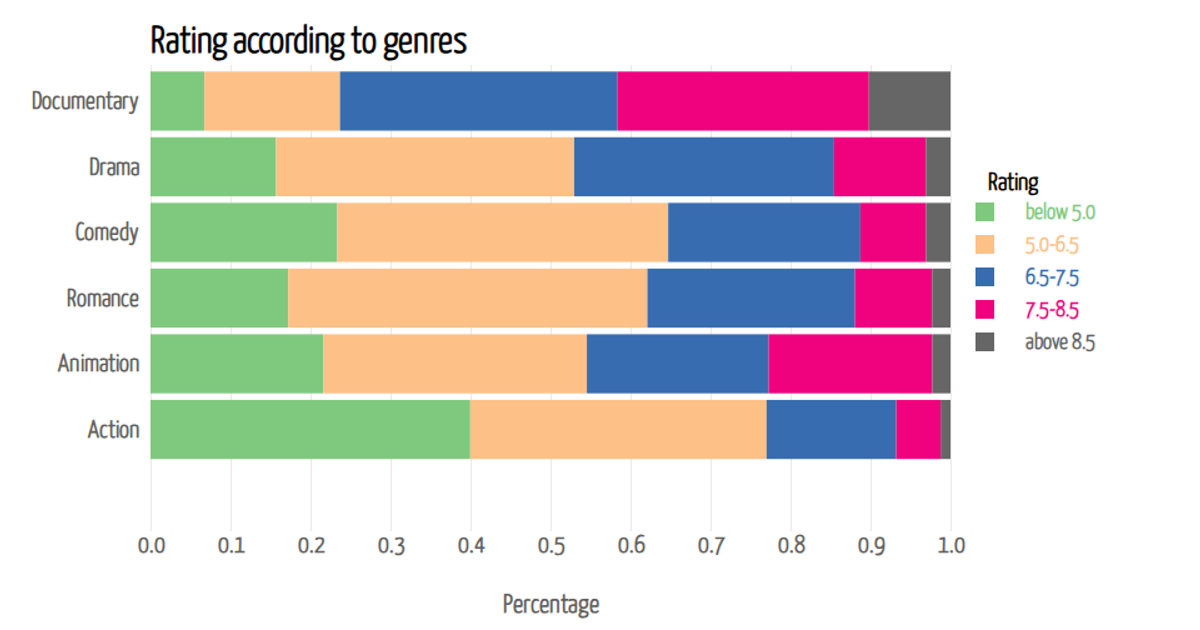
This visualization presents a treemap of Netflix IMDB scores, using a dataset from Kaggle. The hierarchical layout partitions the screen into nested rectangles, with each leaf representing a data point and colored by its parent category. The code employs d3.hierarchy and d3.treemap to compute the layout, while d3.scaleOrdinal with a spectral color scheme assigns fills. Text labels display identifiers for each rectangle. The data is loaded from a package and rendered as an SVG within a container, demonstrating a straightforward categorical breakdown of the score distribution.
AI-generated descriptionThe Netflix IMDB Scores,
Questions
Choosing the right type of graph or chart to best represent the data is crucial.
- A box plot or violin plot could be useful for this ?
MIT Licensed


Comments
Sign in to join the discussion.