🌍 Public
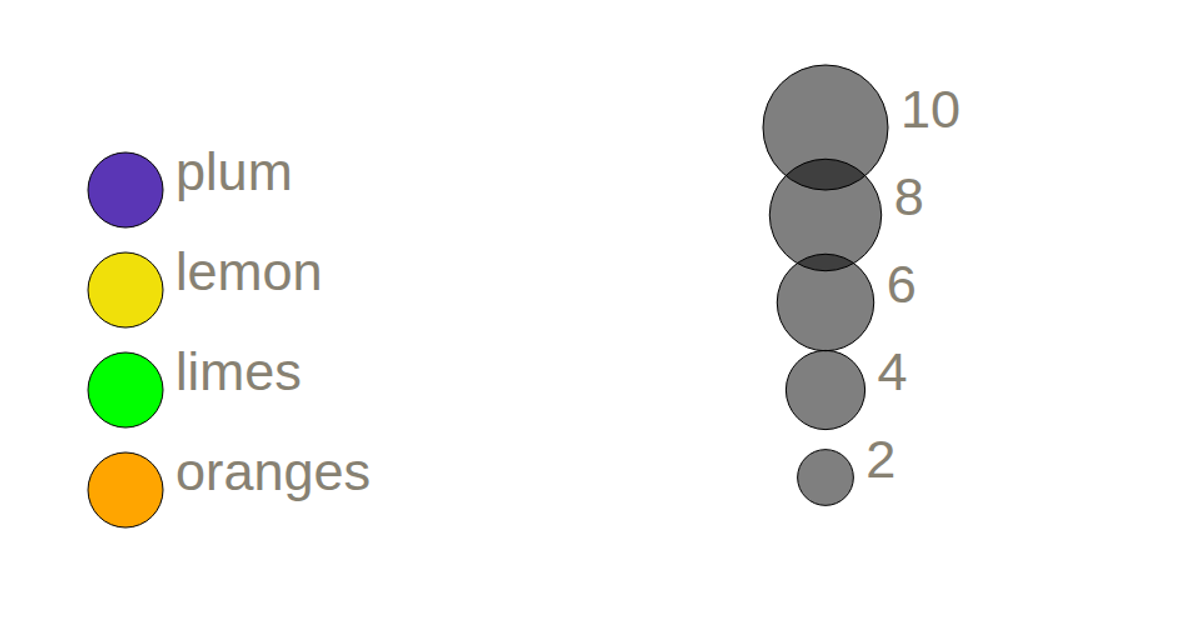
color and size lengend
This example demonstrates two legends: a categorical color legend for fruits like apples and lemons, and a quantitative size legend for population data. The color legend uses `d3.scaleOrdinal` to assign fixed colors, while the size legend uses `d3.scaleSqrt` to map numeric ticks to circle radii. Both legends are rendered as SVG groups, with circles and text labels positioned via translation. The code uses `selection.selectAll` and `.merge` for incremental updates, and the size legend filters out the zero tick. The data source is a CSV listing country populations, though only the legend scales are visualized here.
AI-generated descriptioncolor and size legend.
MIT Licensed




Comments
Sign in to join the discussion.