🌍 Public
Fork of Vega-Lite API Template
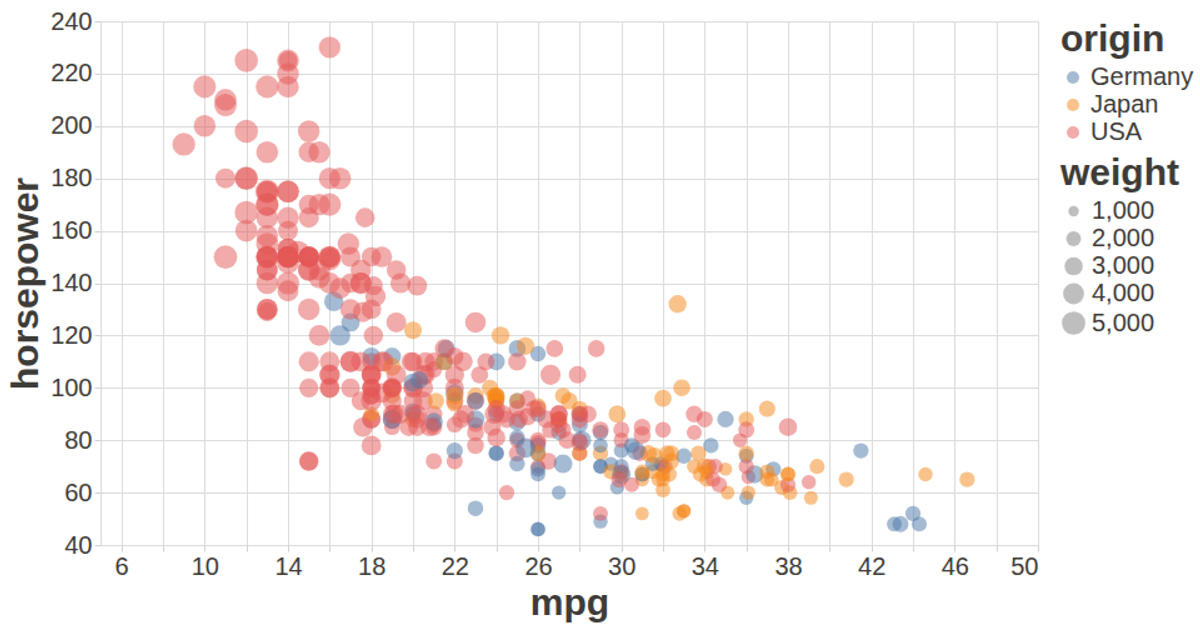
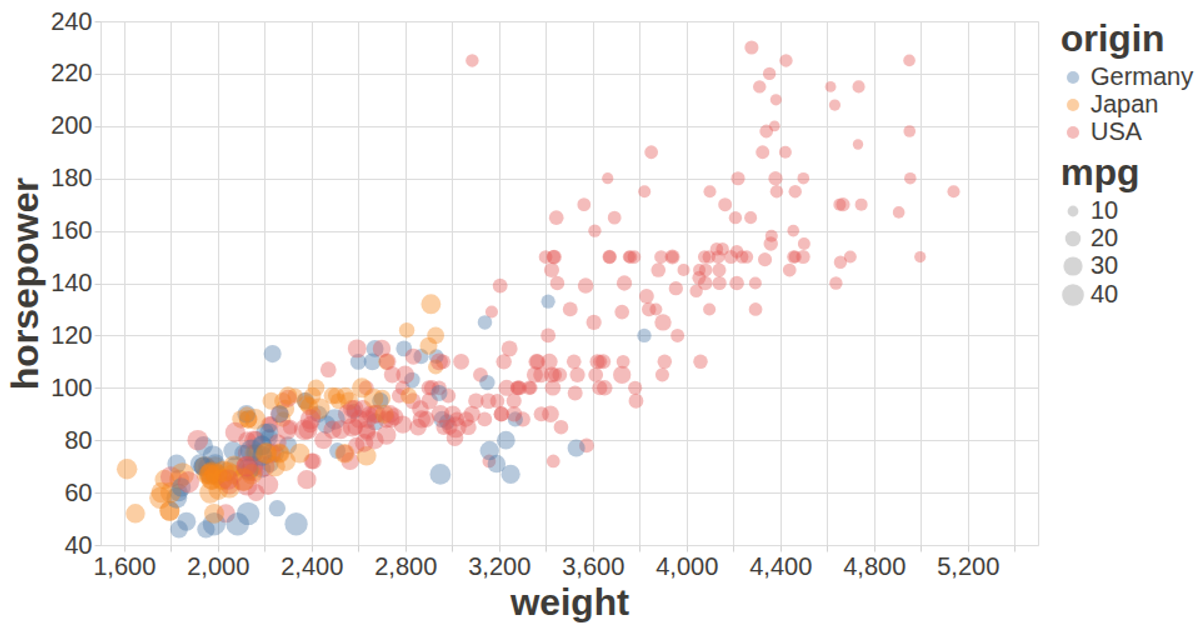
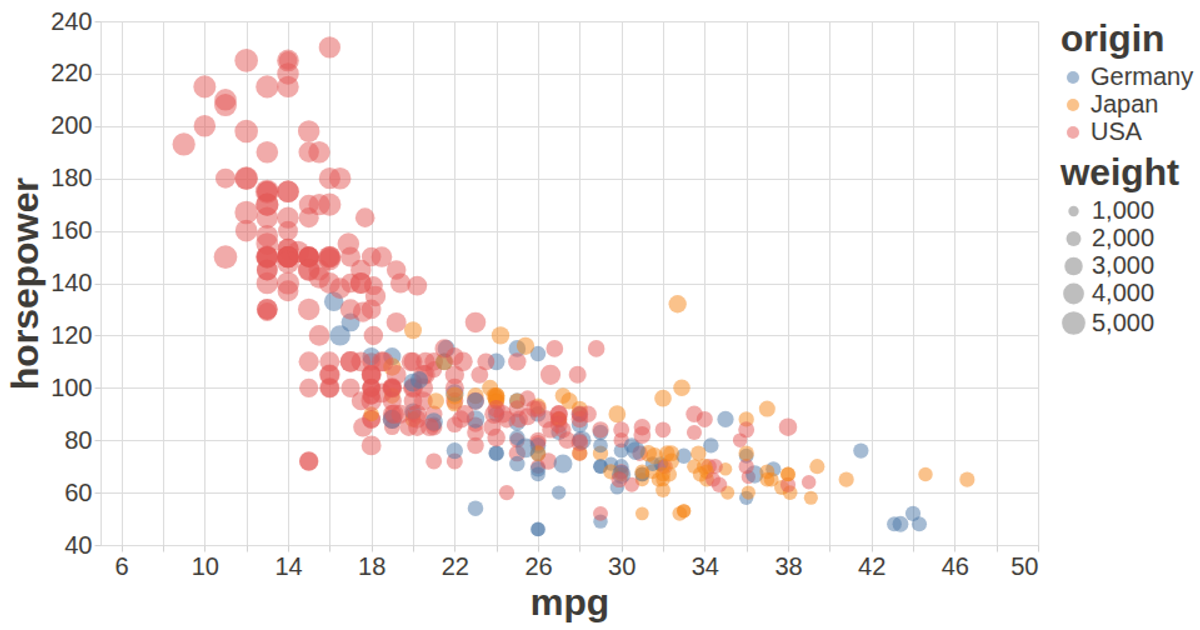
This visualization renders a line chart of the Auto MPG dataset from the UCI Machine Learning Repository, using the Vega-Lite API wrapper for JavaScript. It plots horsepower against weight, with a dual color encoding for weight as both a point color and origin as a categorical color, creating a gradient effect. The chart is built with `vega-lite-api`, `vega`, and `vega-lite`, with data loading via `d3.csv` and tooltips enabled through `vega-tooltip`. The visualization fills the browser window with a custom config for dark text and light gray axes.
AI-generated descriptionA visualization constructed using the vega-lite-api.
The data shown here comes from the UCI Machine Learning Repository: Auto MPG Data Set, via Gist: Scatter Plot with Menus.
MIT Licensed



Comments
Sign in to join the discussion.