🌍 Public
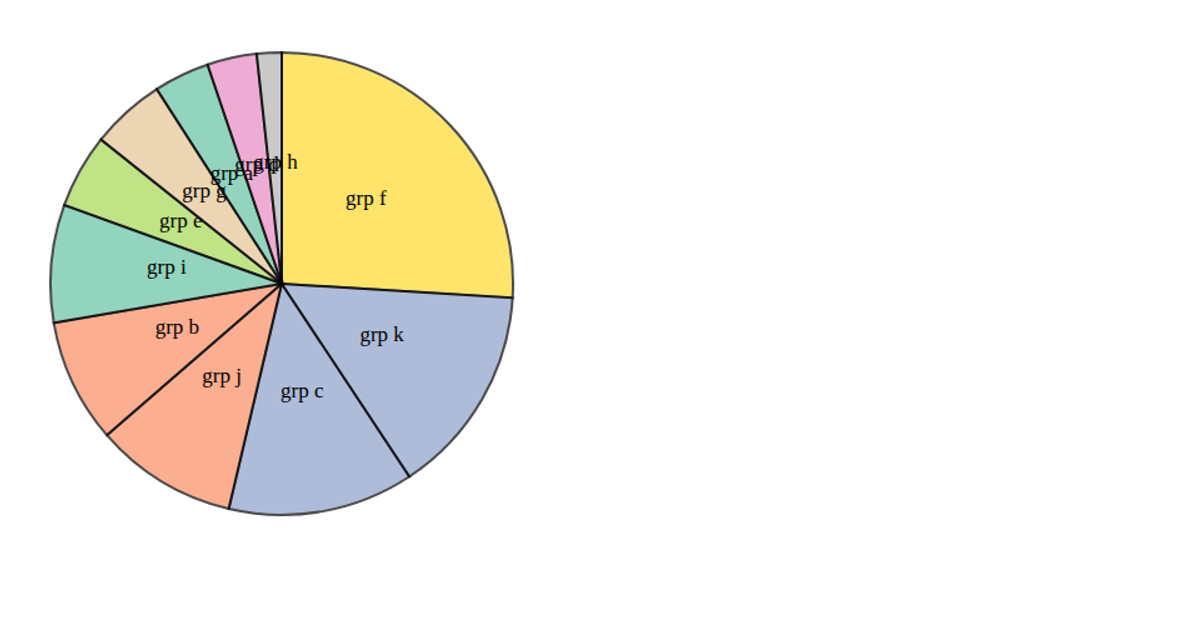
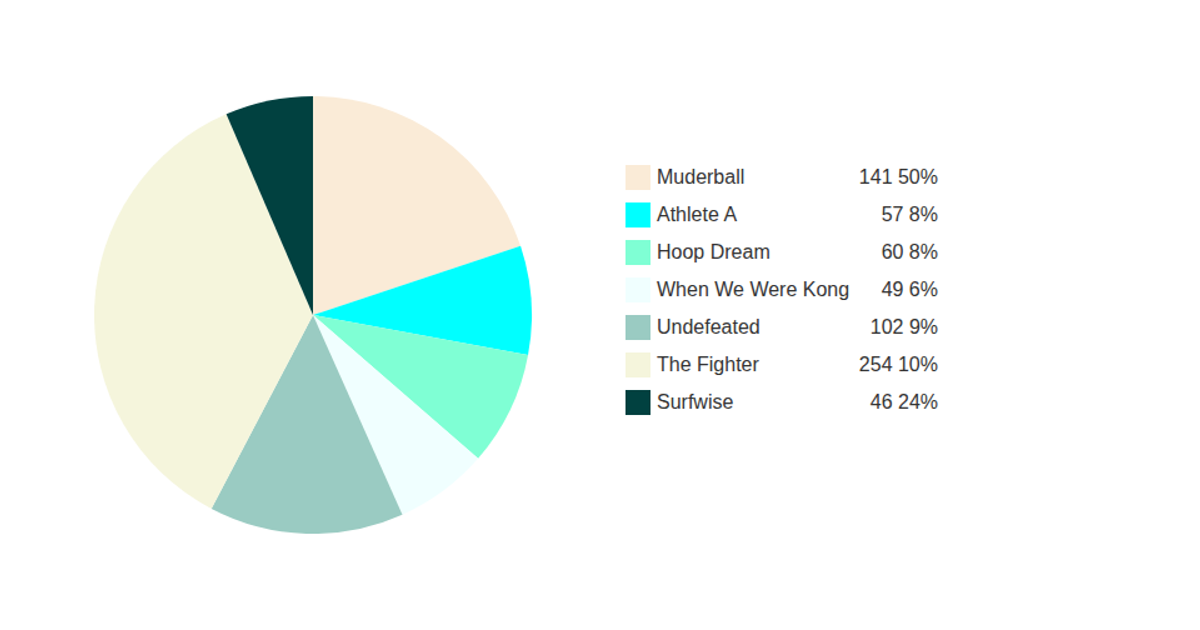
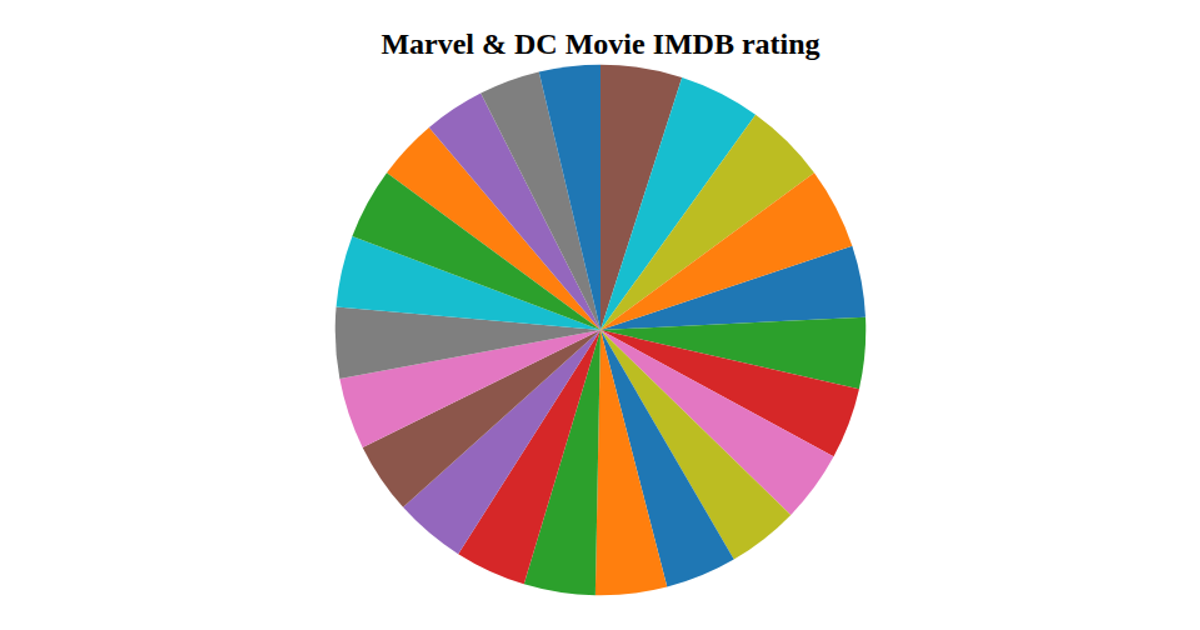
Black Hat Pie Chart
This black hat pie chart visualizes three movie categories—Action, SciFi, and Comedy—with data values of 20, 40, and 10, but displays deliberately misleading percentage labels (49%, 60%, 22%) to illustrate deceptive visualization practices. The D3 v4 code uses `d3.pie()` with `d3.entries()` to compute slice arcs, `d3.arc()` to generate SVG paths, and `d3.scaleOrdinal()` with the `schemeSet3` color palette for fill colors. Text labels are positioned using the arc generator’s `centroid` method, with an overall title added via a separate SVG text element.
AI-generated descriptionA bare minimum HTML page demonstrating use of CSS and JavaScript.
See also React Starter.
MIT Licensed




Comments
Sign in to join the discussion.