🌍 Public
HARIARMA
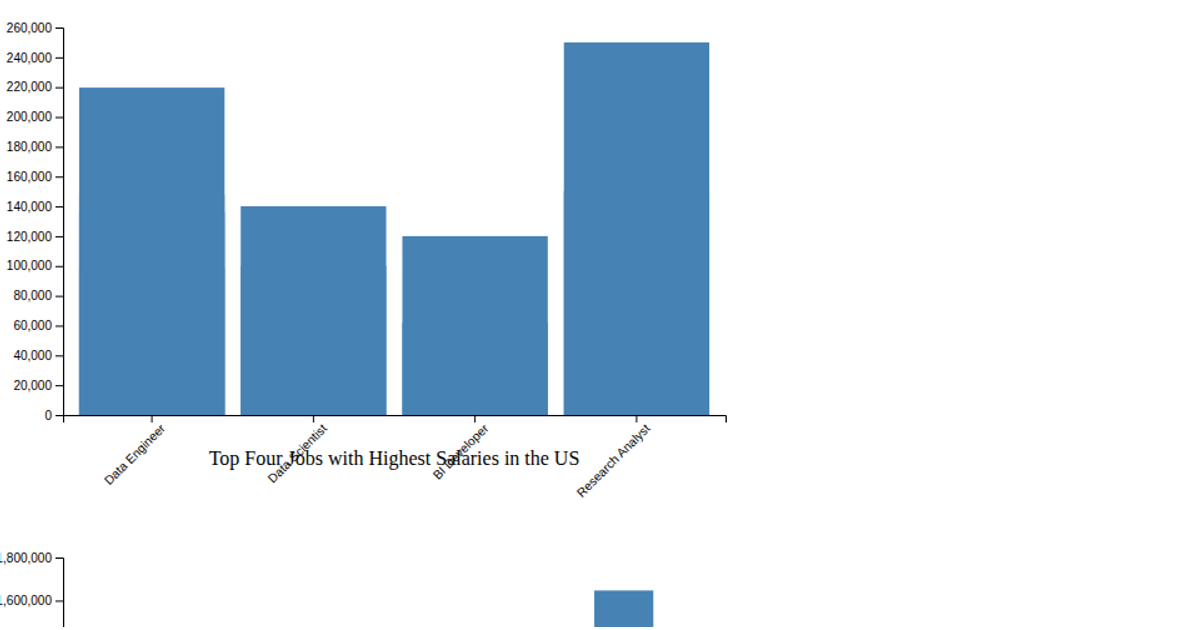
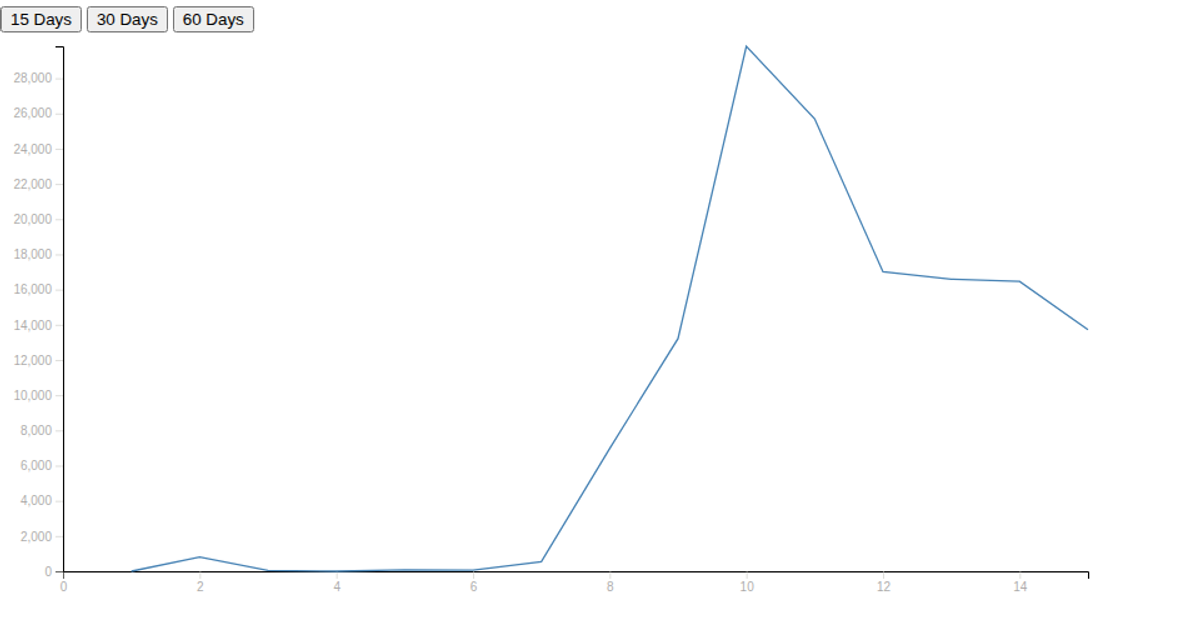
Two line charts display the F3 and F4 time-series data from CSV files, comparing actual values with forecasts from SARIMAX, ARMA, and ARIMA models. Interactive buttons trigger updates to the displayed forecast series. The visualization uses D3.js for SVG rendering, with `d3.svg.line` and `d3.time.format` handling the path generation and coordinate scaling.
AI-generated descriptionAn example showing the capabilities of VizHub:
- Loads D3 via UNPKG.
- Demonstrates use of
importfrom"d3". - Demonstrates use of
importfrom local ES6 modules.
MIT Licensed



Comments
Sign in to join the discussion.