🌍 Public
Activity4_Task4
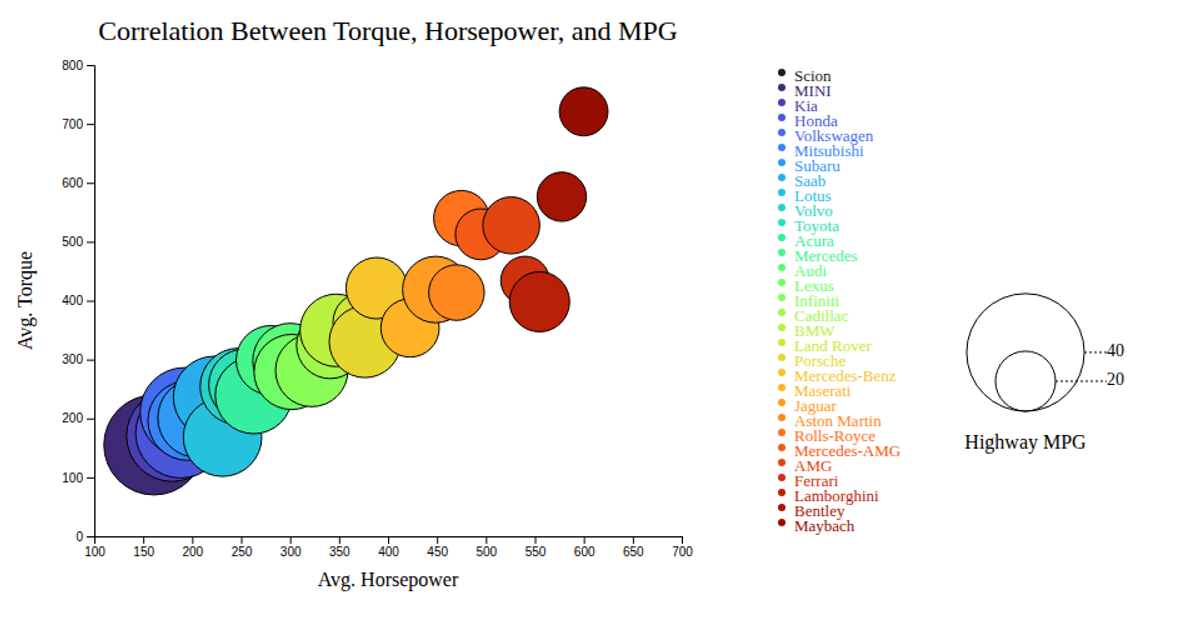
This bubble chart visualizes the correlation between average horsepower, torque, and highway fuel efficiency across car makes, with horsepower on the x-axis, torque on the y-axis, and bubble size encoding MPG. Each bubble is colored by make using a d3.scaleOrdinal with interpolateTurbo, and hovering reveals a tooltip with the car make. The visualization includes a legend for bubble size and uses d3.csv, d3.axisBottom, and d3.axisLeft to render the SVG with animation.
AI-generated descriptionMIT Licensed





Comments
Sign in to join the discussion.