🌍 Public
BMI by Age
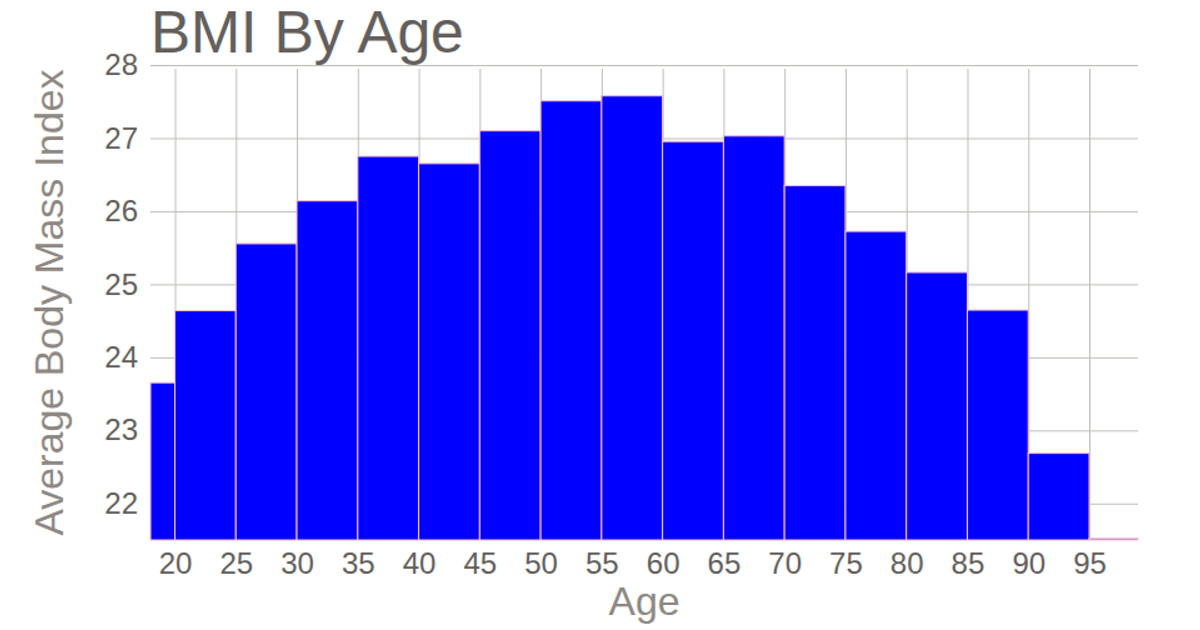
This visualization displays average body mass index (BMI) by age using a bar chart. The data comes from a CSV file containing individual height and weight measurements, from which BMI is calculated. D3.js version 7 is used with SVG rendering, employing `scaleLinear`, `axisLeft`, `axisBottom`, and `bin` to group ages into bins. Orange rectangles represent the average BMI for each age range, with axes labeled "Age" and "Average Body Mass Index."
AI-generated descriptionMIT Licensed



Comments
Sign in to join the discussion.