🌍 Public
D3 Experiment
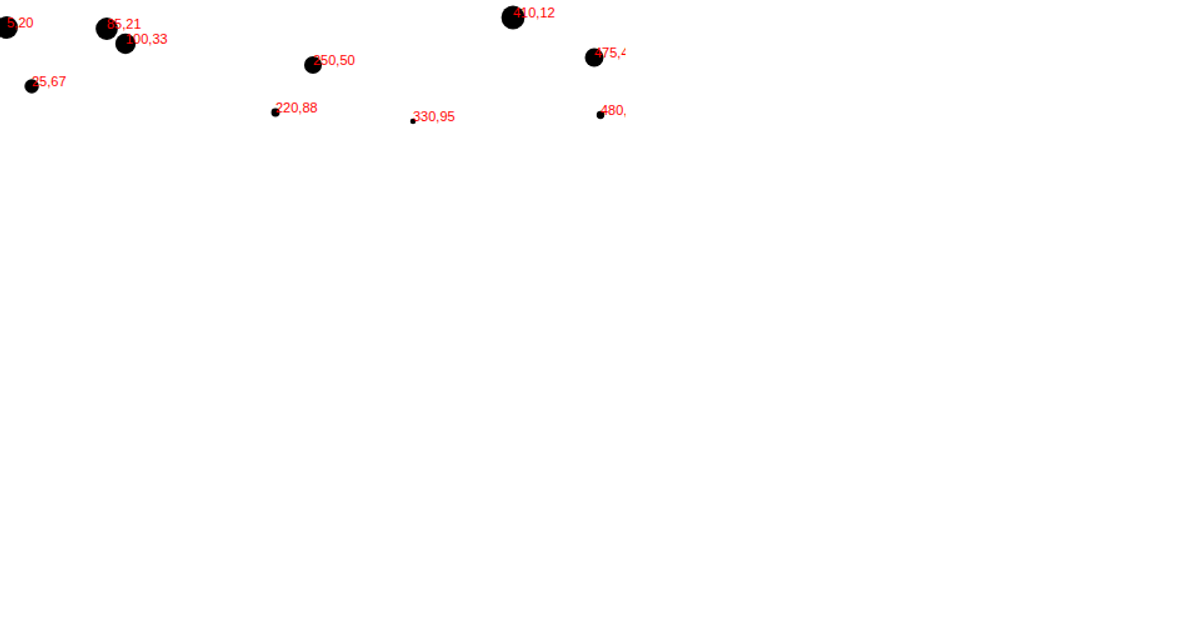
A scatterplot of 20 fictional student marks displays each value as a pink dot, positioned with its value as both horizontal and vertical offset in viewport units, alongside a red underlined title. The example uses D3 v7 selection and join APIs, specifically `d3.select` and `d3.selectAll` with `.data()` and `.join()` to create and bind the data, then appends an SVG circle for each point. Data is hardcoded as an array in the script, and rendering uses SVG elements with absolute positioning.
AI-generated descriptionStarting setup for using D3 version 7
MIT Licensed




Comments
Sign in to join the discussion.