🌍 Public
task -2
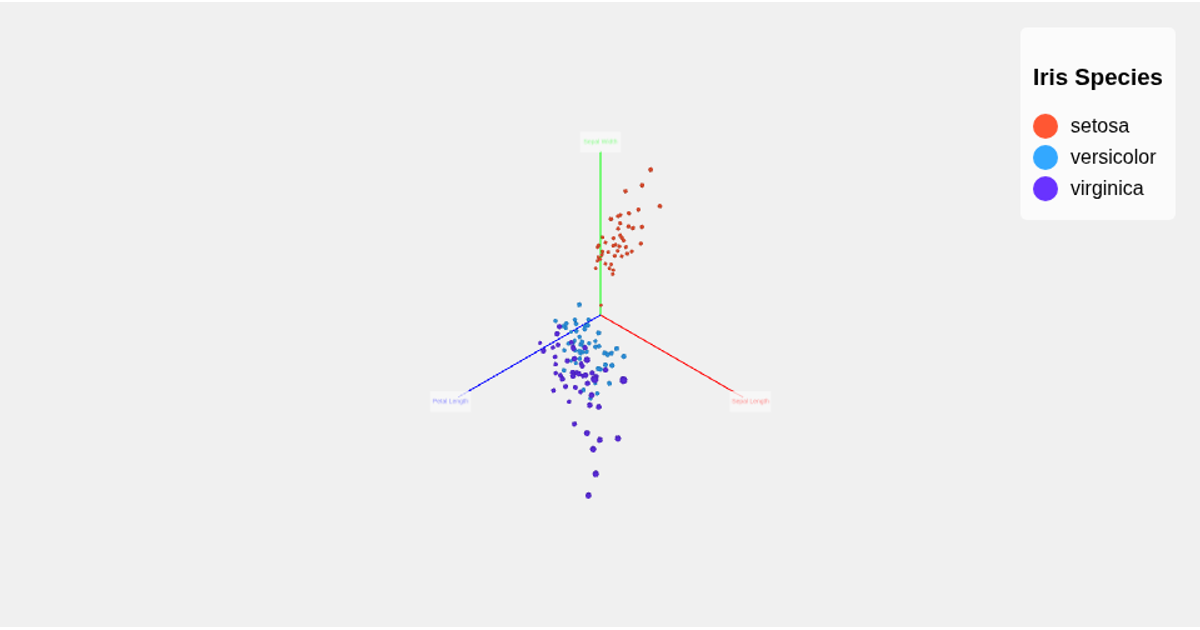
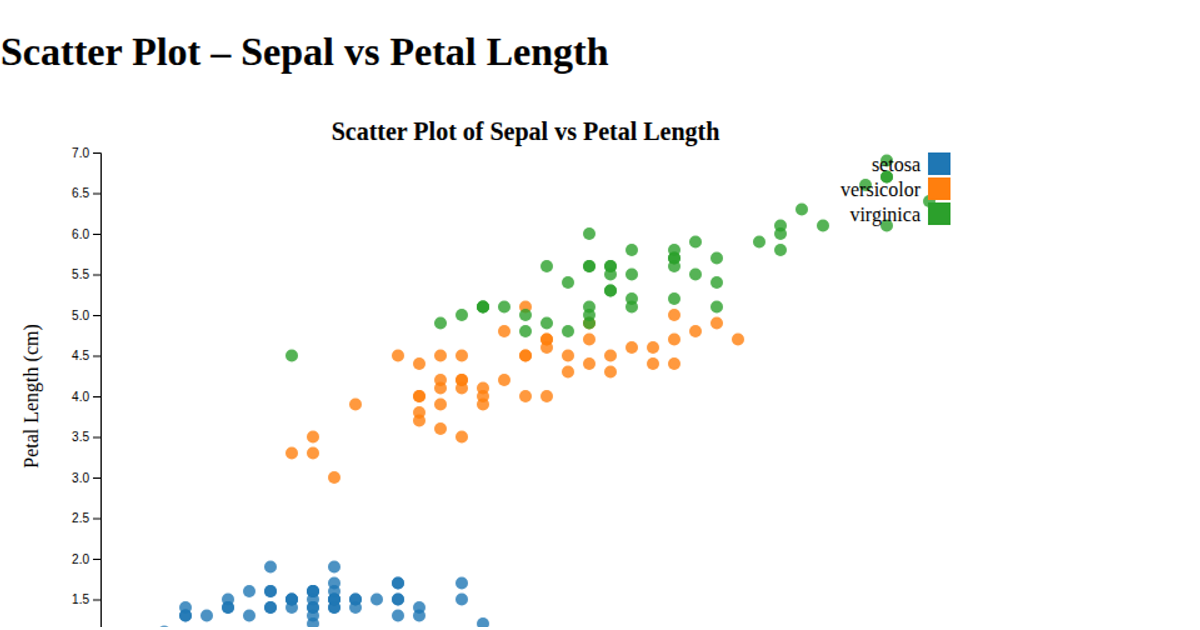
This interactive 3D scatter plot visualizes the Iris flower dataset, showing the relationship between sepal and petal measurements across three species. Users can drag to rotate the visualization, which displays colored points representing individual flowers alongside a wireframe grid and axis labels. The example uses the d3-3d plugin with d3.v4 to project 3D coordinates onto an SVG canvas, handling rotation updates through mouse drag events. Data is loaded from a CSV file and rendered with WebGL, with points colored by species category.
AI-generated descriptionMIT Licensed



Comments
Sign in to join the discussion.