🌍 Public
Loading and Parsing CSV Data
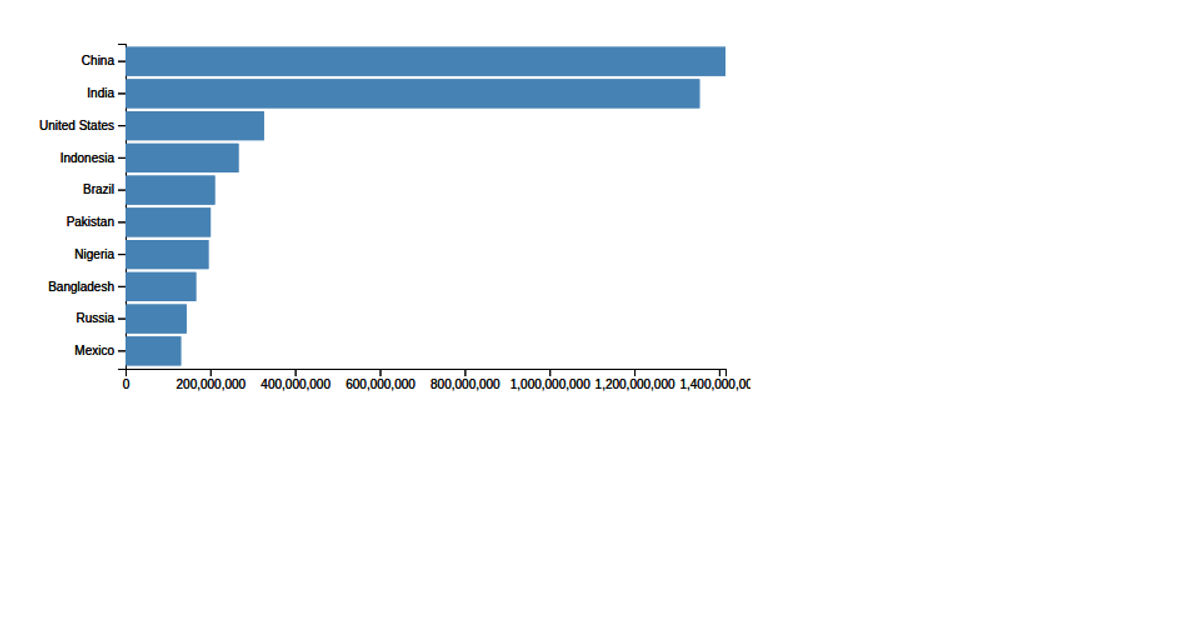
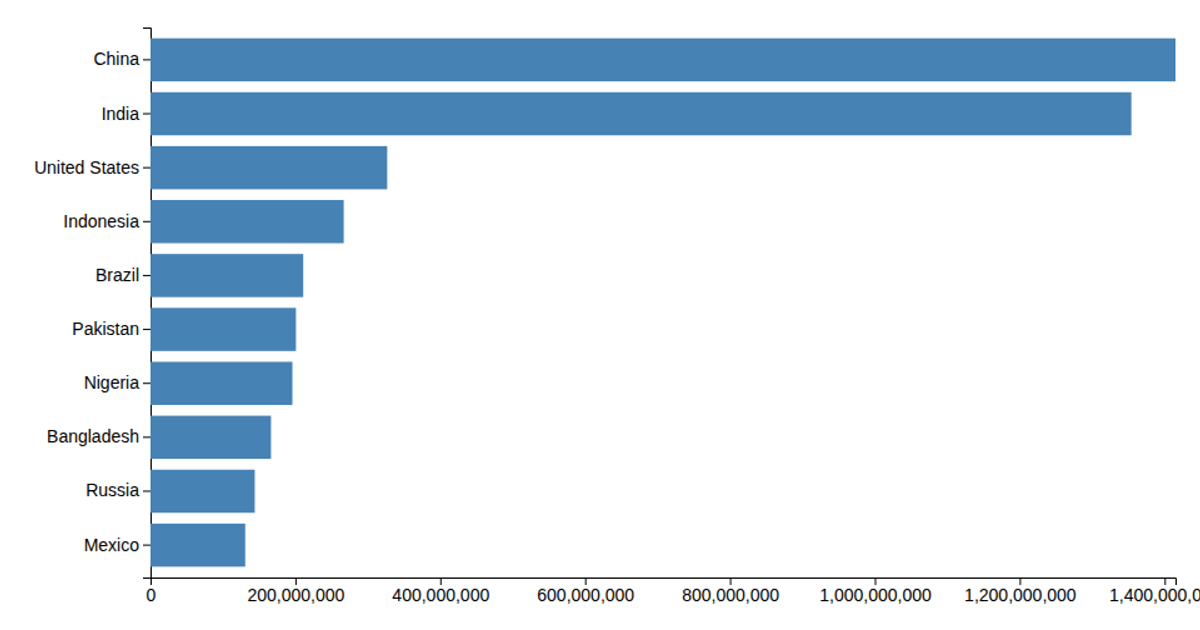
This visualization presents a horizontal bar chart of country populations, ranking nations from China to Mexico. It demonstrates how to load external CSV data and convert it into a visual form. Using D3 v5, the code employs `select`, `csv`, `scaleLinear`, `scaleBand`, and `max` to parse the data file, transform population values from thousands to raw counts, and map them to bar lengths. The SVG rendering scales the bands to fit the fixed canvas dimensions.
AI-generated descriptionMIT Licensed





Comments
Sign in to join the discussion.