🌍 Public
Line Chart
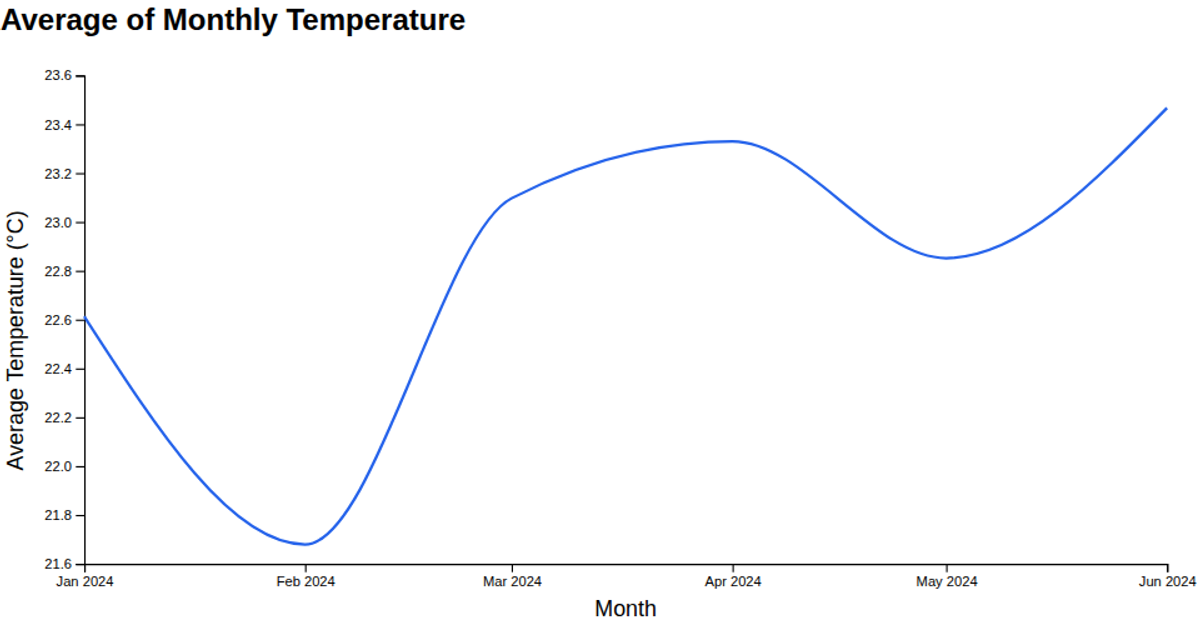
This line chart visualizes January temperatures in the United States from 1895 to 2023, using data from NOAA’s Climate at a Glance dataset. It plots temperature in degrees Fahrenheit against time, revealing long-term trends and yearly fluctuations. The visualization is built with D3 v7, using `scaleTime` and `scaleLinear` for axes, `line` to generate the path, and `scaleLinear` for the y-axis, with data loaded via `csvParse`.
AI-generated descriptionA line chart of the Climate Dataset. It gives climate at glance in US for the month of January from year 1895 to 2023.
MIT Licensed




Comments
Sign in to join the discussion.