Fork of Dishonest Bar Chart
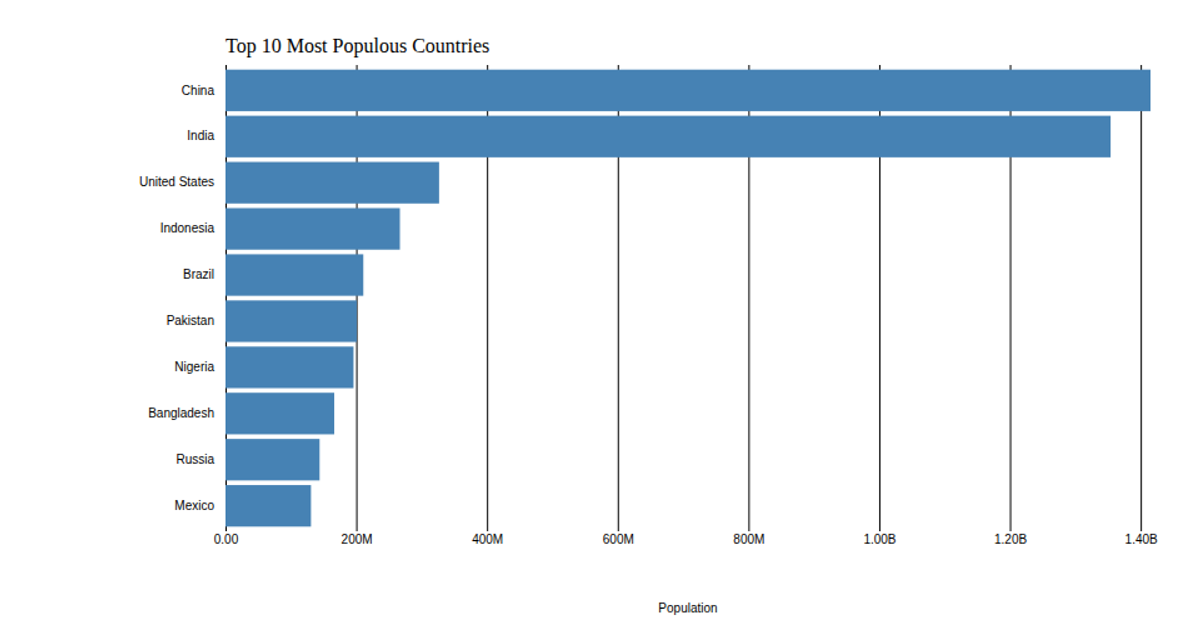
This bar chart displays population estimates for the top 10 most populous countries from the 2018 United Nations World Population Prospects, intentionally omitting a zero baseline to illustrate how truncated axes exaggerate visual differences. The chart uses d3.scaleLinear and d3.scaleBand to map population values and country names, rendering horizontal bars as SVG rectangles. Axis tick labels are formatted with d3.format, and the data is loaded from a CSV file via d3.csv. The design highlights a common data-visualization pitfall rather than following best practices.
AI-generated descriptionThis bar charts does not use a zero baseline. It's an example of how not to use area.
This bar chart shows population of the top 10 most populous countries. The data comes from the year 2018 estimate in United Nations: World Population Prospects 2017.


Comments
Sign in to join the discussion.