🌍 Public
Female labor force Participation Rate
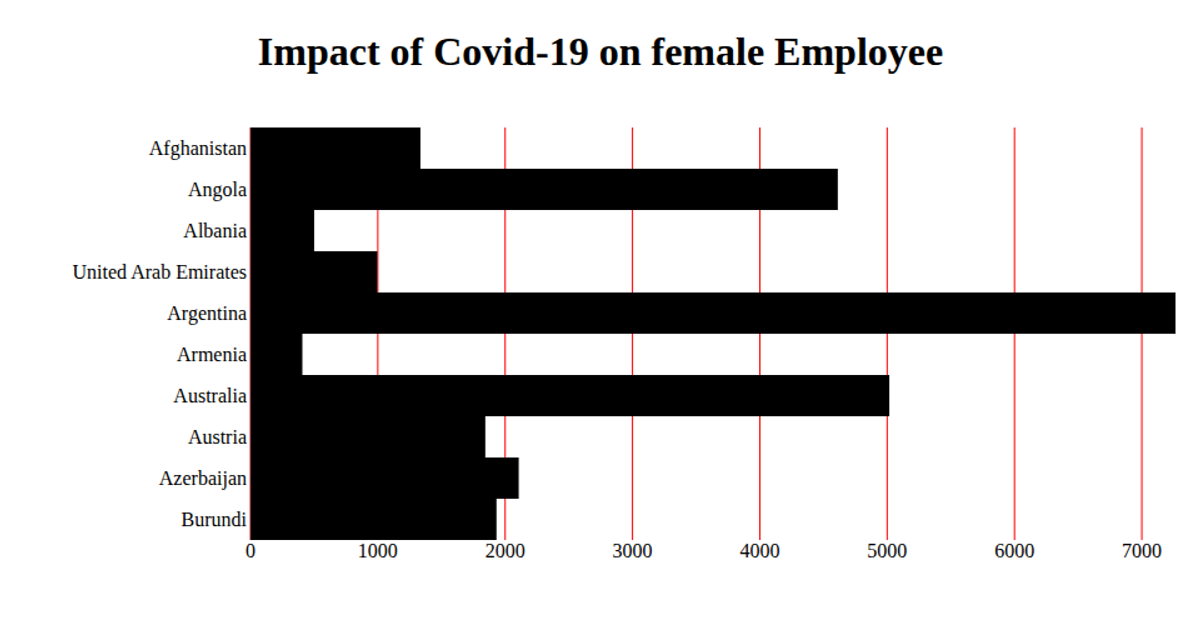
This bar chart displays the female labor force participation rate for ten countries, with horizontal bars representing percentages from 0 to 100. The visualization uses D3 v6's `scaleLinear` for the x-axis, `scaleBand` for the categorical country labels, and SVG rectangles rendered through React. Data from the CSV file is parsed and mapped to bar widths, with axes generated via `axisLeft` and `axisBottom`.
AI-generated descriptionA bare minimum HTML page demonstrating use of CSS and JavaScript.
See also React Starter.
MIT Licensed




Comments
Sign in to join the discussion.