🌍 Public
Stock Price Change
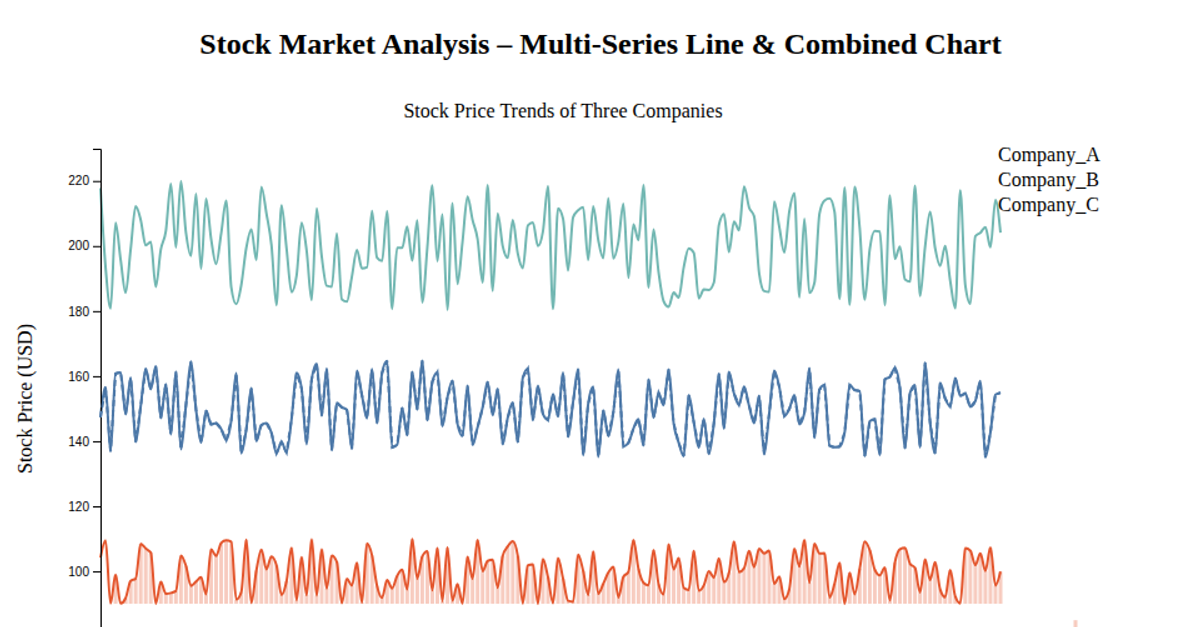
This chart displays how multiple stock-related values change over time as a stacked area graph. Using d3.csv to load a wide-format dataset, it maps years on the x-axis and numerical point values on the y-axis. The code employs d3.stack to aggregate six categories, which are rendered as colored SVG paths via d3.area, with a scaleOrdinal providing the palette. Axes are generated with scaleTime, scaleLinear, and d3.axisBottom/axisLeft, while labels for “Year” and “Points” are appended as SVG text elements.
AI-generated descriptionMIT Licensed




Comments
Sign in to join the discussion.