🌍 Public
Yaswanth_Duddu_ICE7
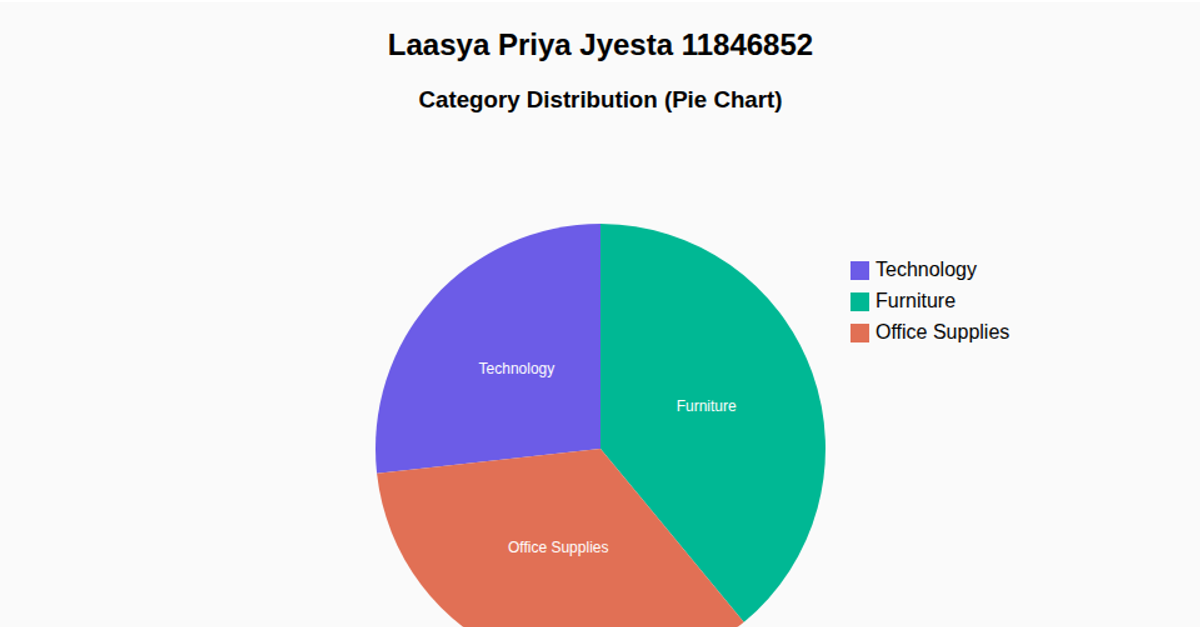
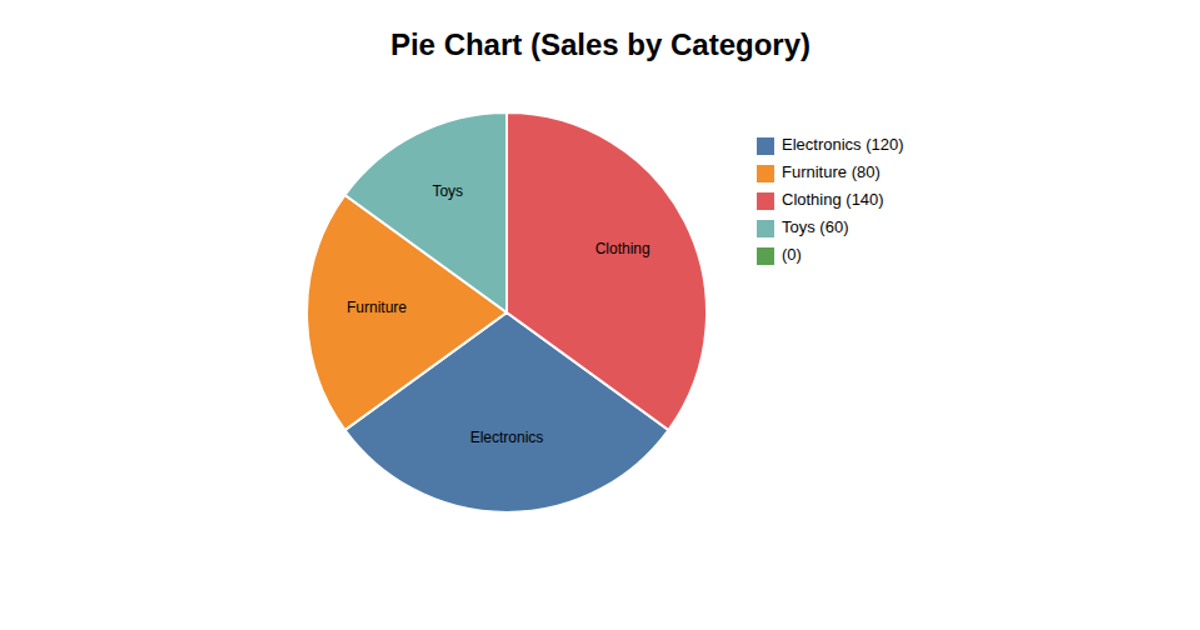
This example displays a reusable pie chart showing category shares for a small retail dataset of six items like Grocery and Electronics, with hover tooltips revealing exact values. Built with D3 v7, the chart generates an SVG pie layout using `d3.pie` and arc generators, with slice labels placed along polylines and a separate legend. The code is structured as a configurable pie chart factory function, allowing flexible accessor settings for name and value, and supports responsive resizing within its container. A halo effect on labels and a fixed tooltip enhance readability.
AI-generated descriptionMIT Licensed




Comments
Sign in to join the discussion.