🌍 Public
Assignment_7_Q2
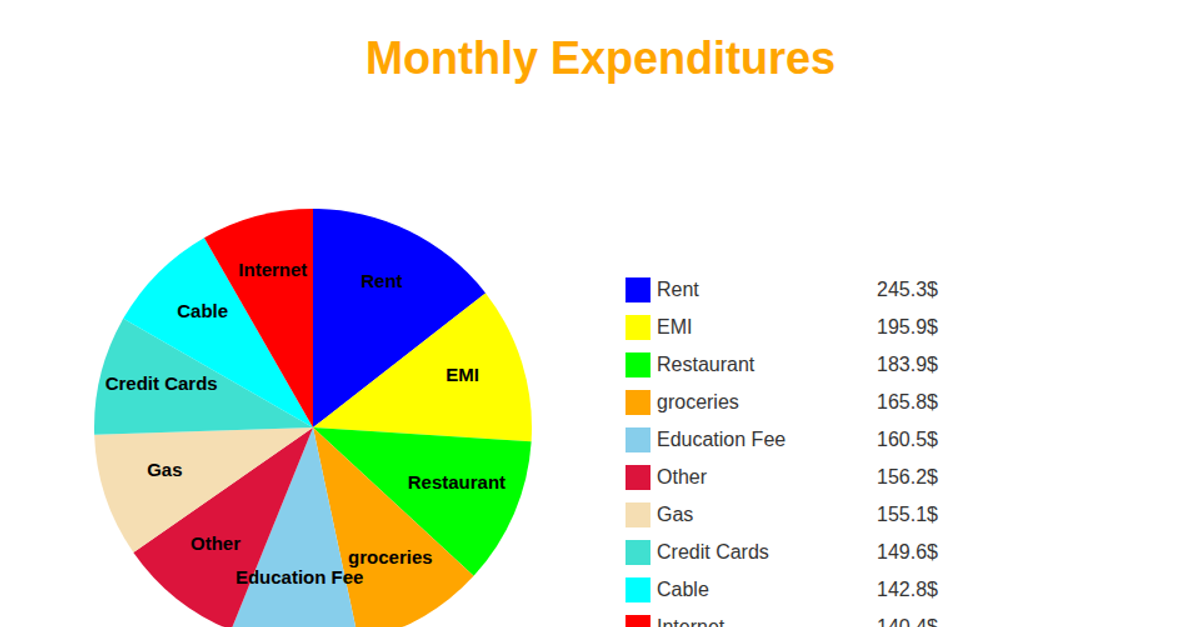
This pie chart visualizes total expenses aggregated by region from an inline CSV dataset containing monthly sales, profit, expenses, and region fields. The D3.js (v7) code uses `d3.rollup` and `d3.sum` to aggregate expenses per region, then renders SVG slices with `d3.pie` and `d3.arc`. Interactive tooltips appear on mouseover showing the exact expense value, while slice labels display percentage shares (hidden below 5%). A legend with color-coded rectangles identifies each region and its total expenses, using `d3.scaleOrdinal` with the `schemeTableau10` color scheme.
AI-generated descriptionMIT Licensed






Comments
Sign in to join the discussion.