🌍 Public
Fork of NUR BARS
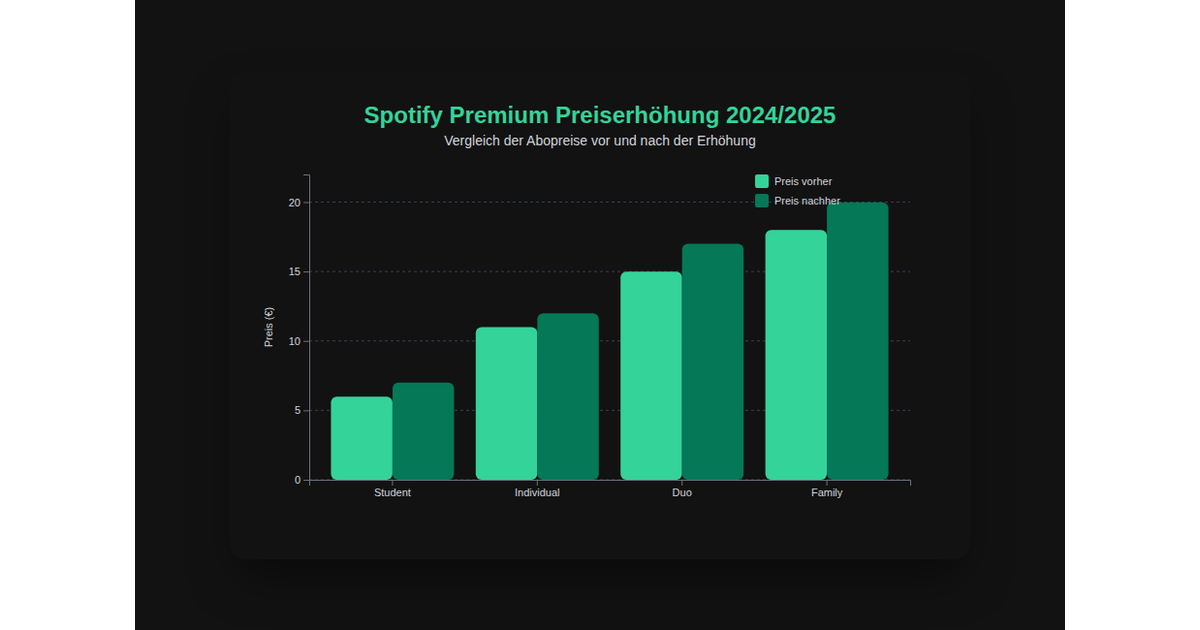
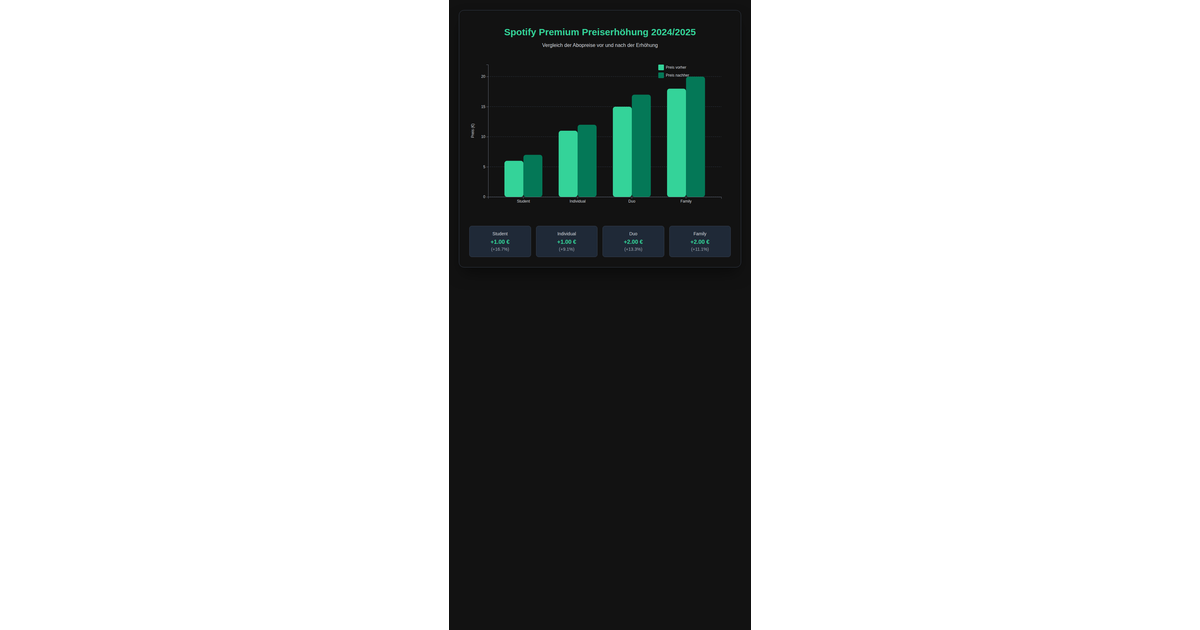
This example visualizes Spotify Premium price increases from 2024 to 2025 by displaying grouped bar charts for four subscription models (Student, Individual, Duo, Family). The dark-themed SVG chart uses D3 v7’s `scaleBand` and `scaleLinear` to position bars, with green bars showing prices before and after the increase. Interactive tooltips appear on mouseover via D3 event handlers, while axis labels, gridlines, and a legend provide context. The React 19 app renders the visualization through `renderBarChart` with the specified data.
AI-generated descriptionMIT Licensed



Comments
Sign in to join the discussion.