🌍 Public
Melting Data for Multiple Lines
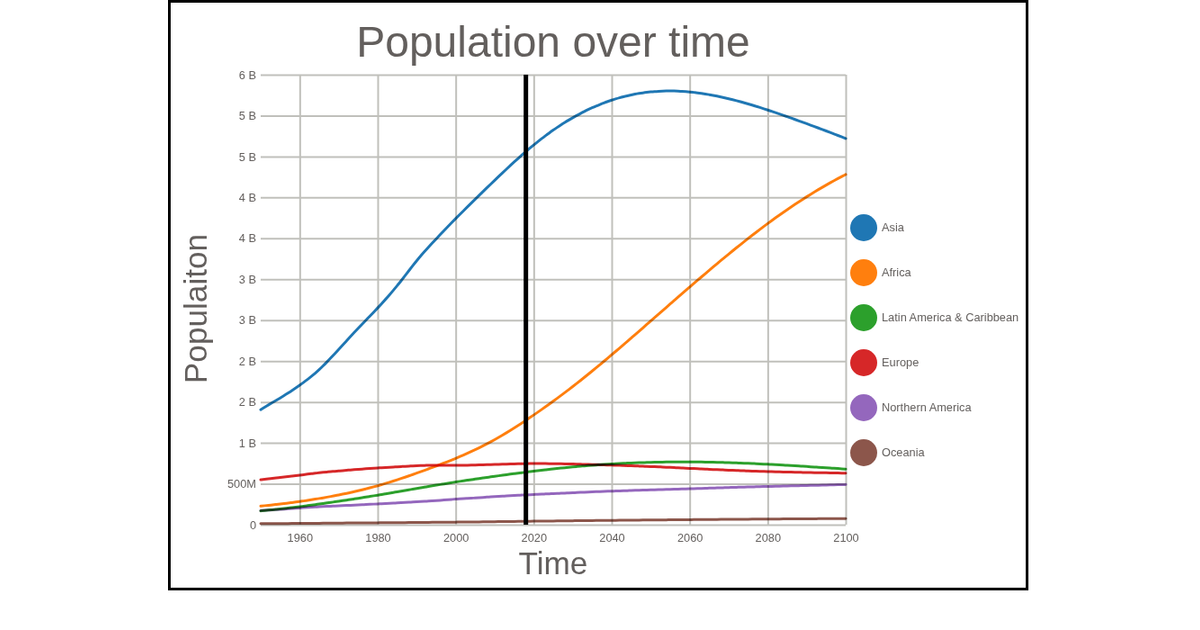
The chart displays world population projections from 1950 to 2100, distinguishing development groups such as more developed, less developed, and least developed countries. The United Nations data is split into two CSV files and melted into a single, tidy format for visualization. Multiple colored lines are rendered as SVG paths using `d3.line` with `curveBasis`, positioned by `scaleTime` and `scaleLinear`. A vertical line marks the year 2018, and a custom `colorLegend` shows the categorical mapping using `d3.scaleOrdinal` with `schemeCategory10`.
AI-generated descriptionMIT Licensed







Comments
Sign in to join the discussion.