🌍 Public
Making a Bar Chart
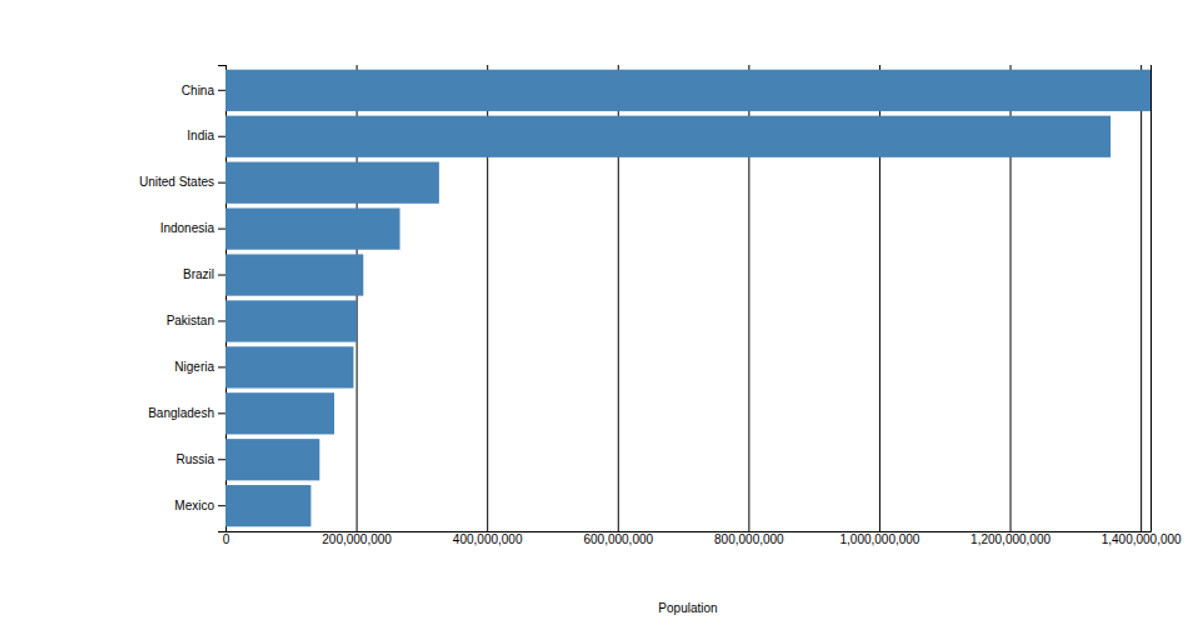
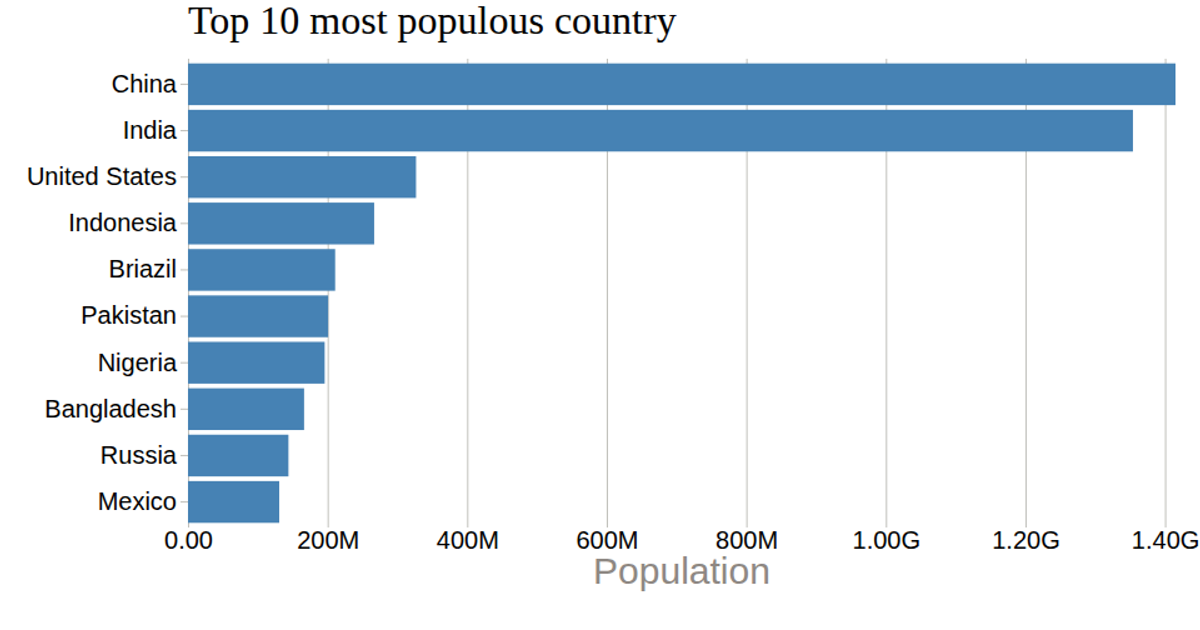
This example shows a horizontal bar chart of the top 10 most populous countries, with population values read from a CSV file and rendered as SVG rectangles. It uses d3.csv to load the data, d3.scaleLinear for the x-axis, d3.scaleBand for the y-axis categories, and d3.axisLeft and d3.axisBottom to draw the axes. The chart includes a formatted x-axis tick label using d3.format, a title, and a population axis label, all styled via external CSS.
AI-generated descriptionA bare minimum HTML page.
See also React Starter.
MIT Licensed




Comments
Sign in to join the discussion.