🌍 Public
D3.js I do
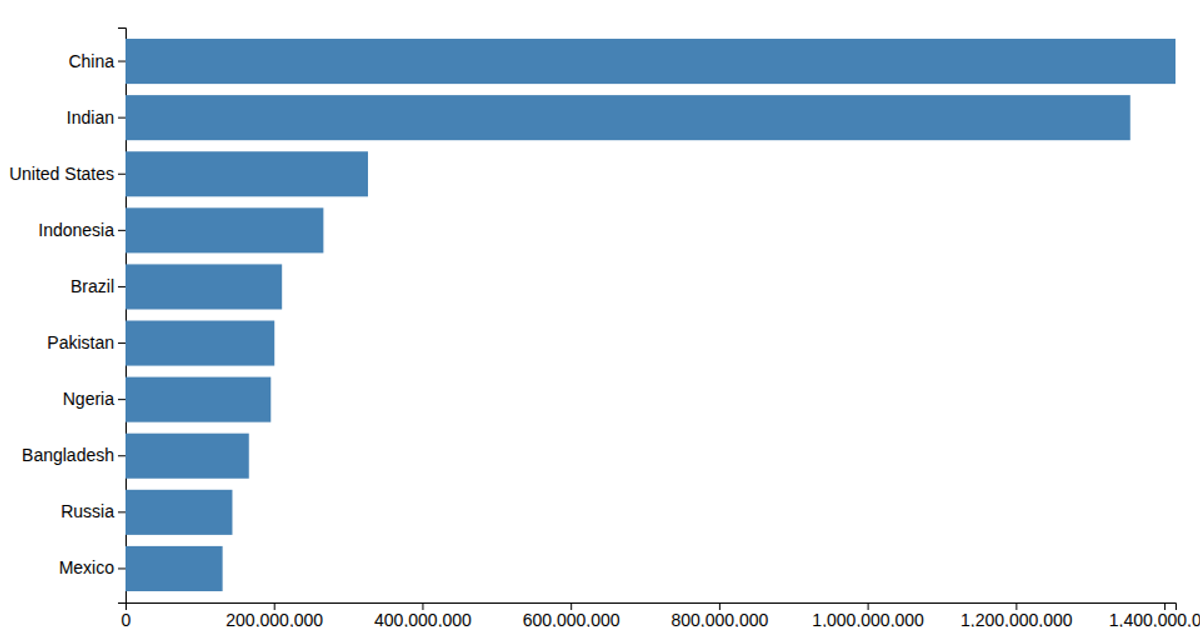
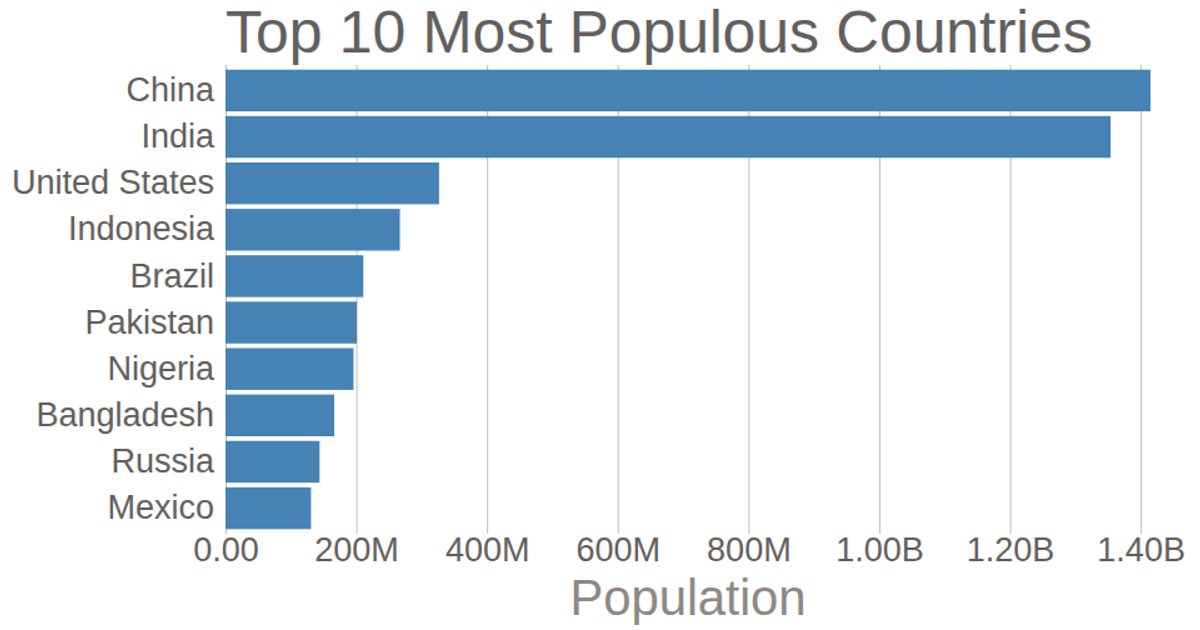
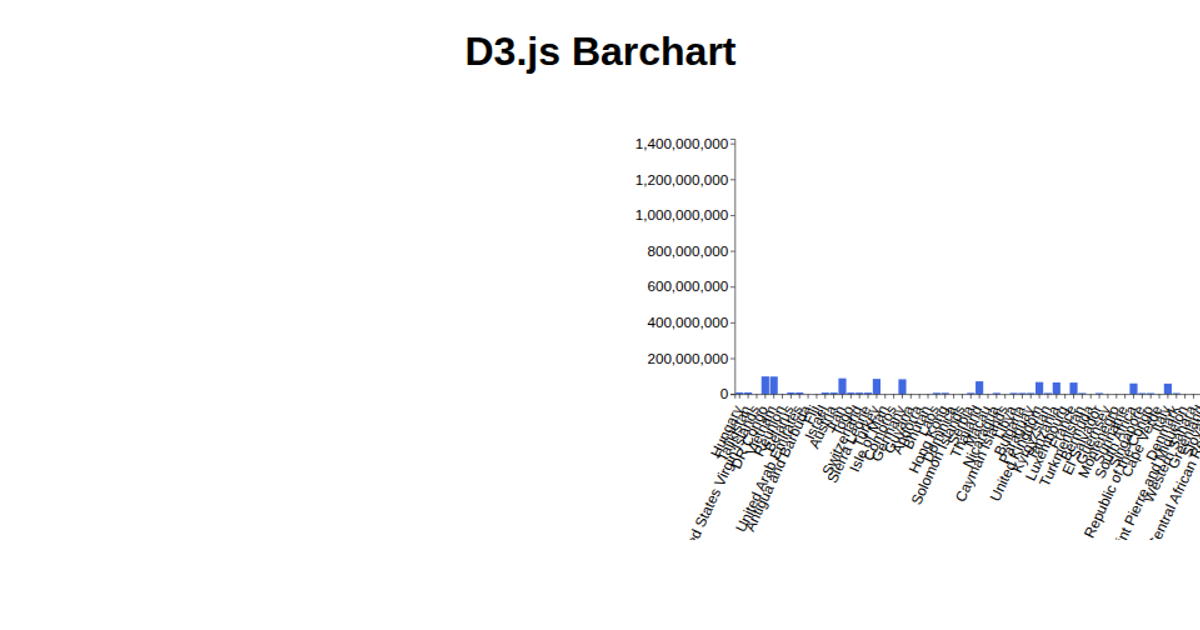
This example shows a bar chart of national populations for the top 13 countries, with the data sourced from a CSV file. The SVG rendering uses D3.js v6, employing `d3.scaleBand` for the categorical x-axis and `d3.scaleLinear` for the numeric y-axis, while the bars are drawn as rectangles. The code also includes labeled axes and rotated x-axis tick labels to accommodate country names.
AI-generated descriptionHistogram from CSV file Data comes from https://population.un.org/wpp/Download/Standard/Population/
MIT Licensed



Comments
Sign in to join the discussion.