🌍 Public
Fork of Social Network Graph --> ICE-8
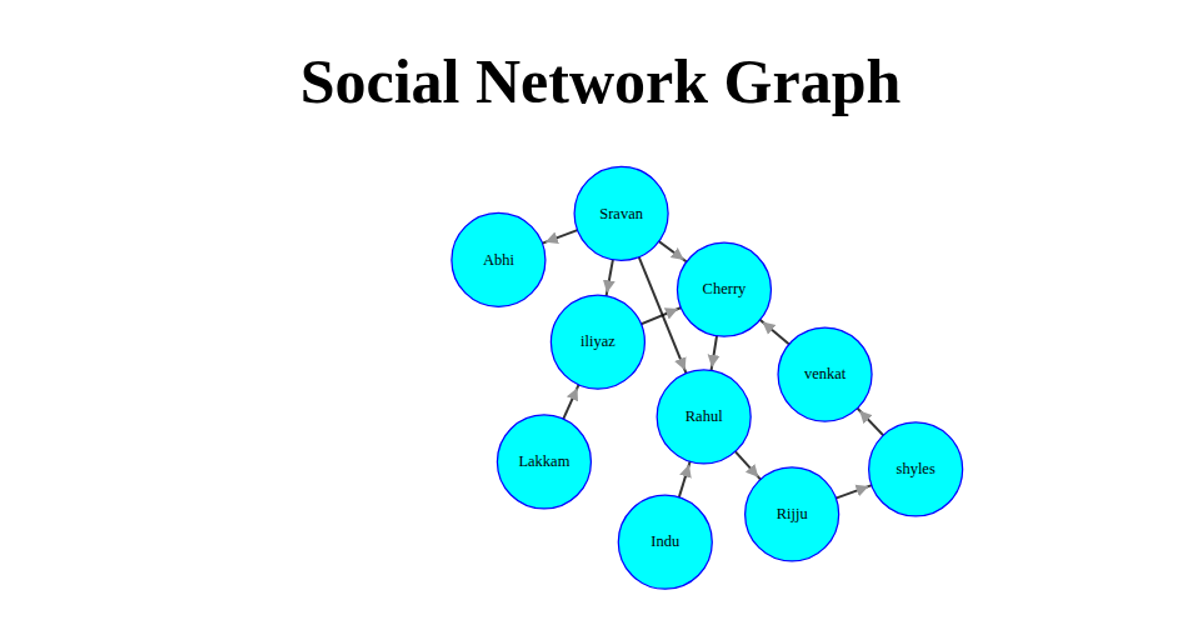
The visualization displays a social network graph where orange circular nodes represent entities like "Pet Controller" and "Owner," connected by red, arrowed lines. It uses `d3.forceSimulation` with `d3.forceLink`, `d3.forceManyBody`, `d3.forceCollide`, and `d3.forceCenter` to position nodes, while `d3.drag` enables interactive movement. The SVG renders from `data.json`, with nodes labeled via `text` and links styled with `marker-end` arrows, highlighted on hover using CSS classes.
AI-generated descriptionMIT Licensed






Comments
Sign in to join the discussion.