Cocktails (Hotaling & Co.)
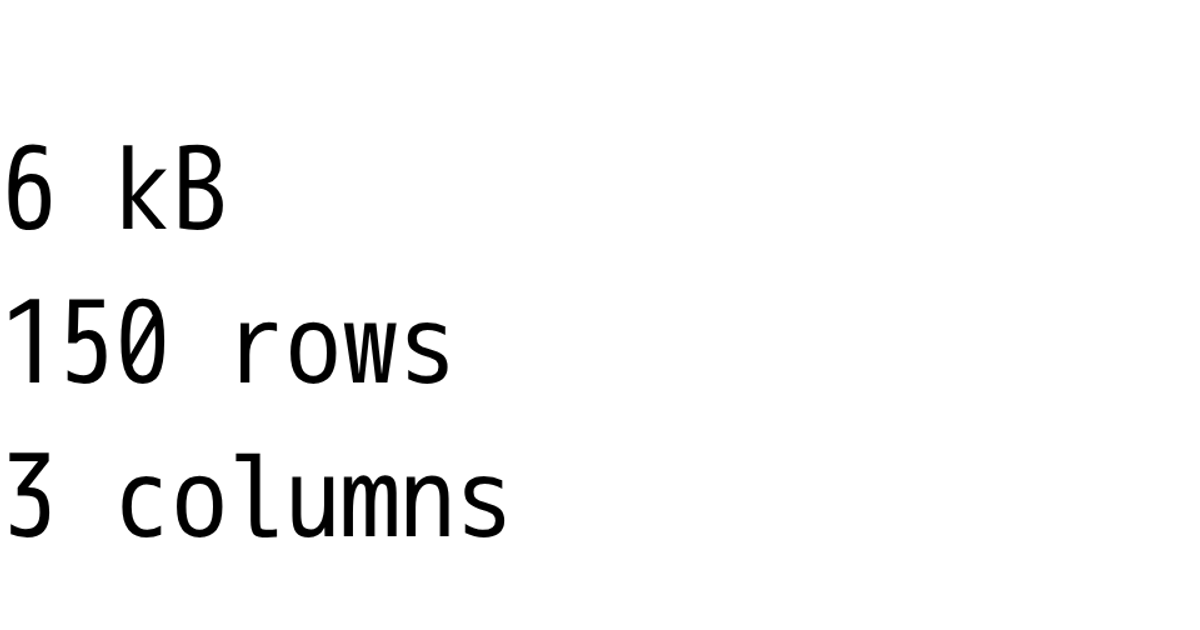
This example displays basic statistics about the Hotaling & Co. cocktail dataset, showing its size in kilobytes, row count, and column count as large text. The page loads a CSV file from a GitHub gist using the `d3.csv` method and formats the data with `d3.csvFormat` to calculate the file size. The visualization serves as a minimal data-loading demonstration, highlighting the dataset’s structure without graphical charts. It also includes commented-out alternatives using `fetch` with async/await and a nested promise approach.
AI-generated descriptionThe hotaling_cocktails - Cocktails.csv dataset contains cocktails collected by alcohol importer and distiller Hotaling & Co. The data is sourced from Kaggle.
The dataset can be used as a means to compare cocktail ingredients.


Comments
Sign in to join the discussion.