🌍 Public
ICE-7 PIE CHART
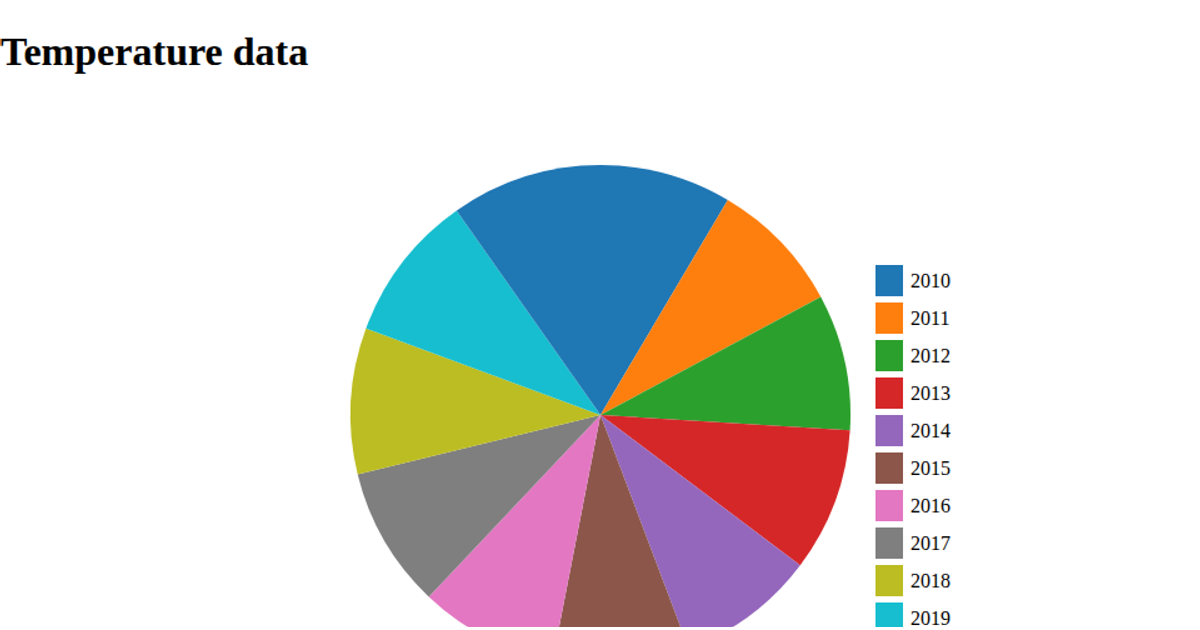
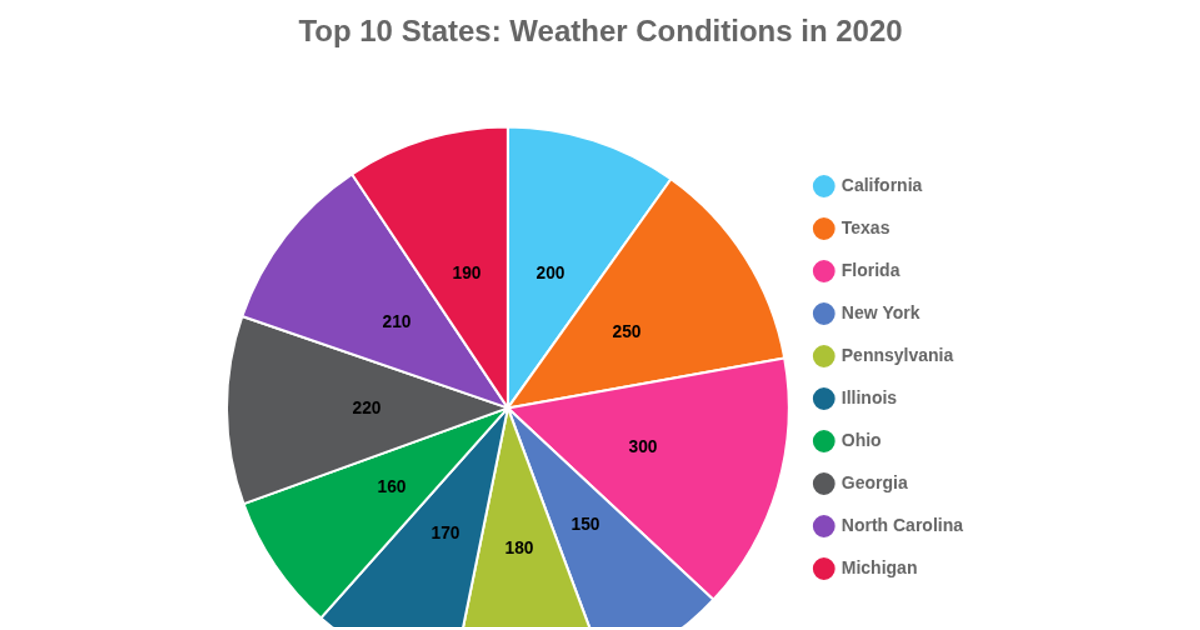
This pie chart shows the highest recorded temperatures per year from 2000 to 2010. Each slice represents a year, labeled with its temperature value and colored according to a categorical scale. The chart is built with D3 v5, using the `pie` and `arc` generators to create SVG paths, and a `scaleOrdinal` for colors. Data is loaded from a raw GitHub CSV via `d3.csv`.
AI-generated descriptionA demonstration of how to start using D3 version 6.
MIT Licensed





Comments
Sign in to join the discussion.