🌍 Public
ModData
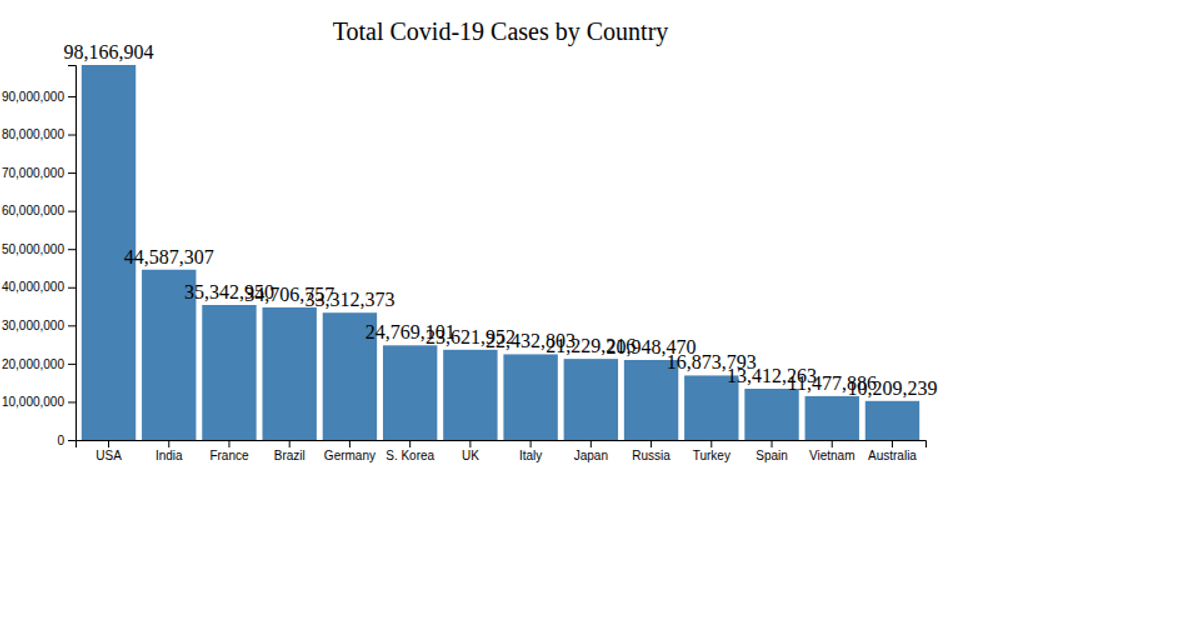
ModData visualizes COVID-19 confirmed case data for multiple countries across 2020 and 2021 using an SVG bar chart. The D3 v5 code loads data from a CSV file, aggregates confirmed cases by country across both years, and renders the results as bars. It uses d3.csv to parse the dataset and a custom aggregation function that sums confirmed cases per country before storing them in a global array for display.
AI-generated descriptionMIT Licensed




Comments
Sign in to join the discussion.