🌍 Public
why duration not working faster
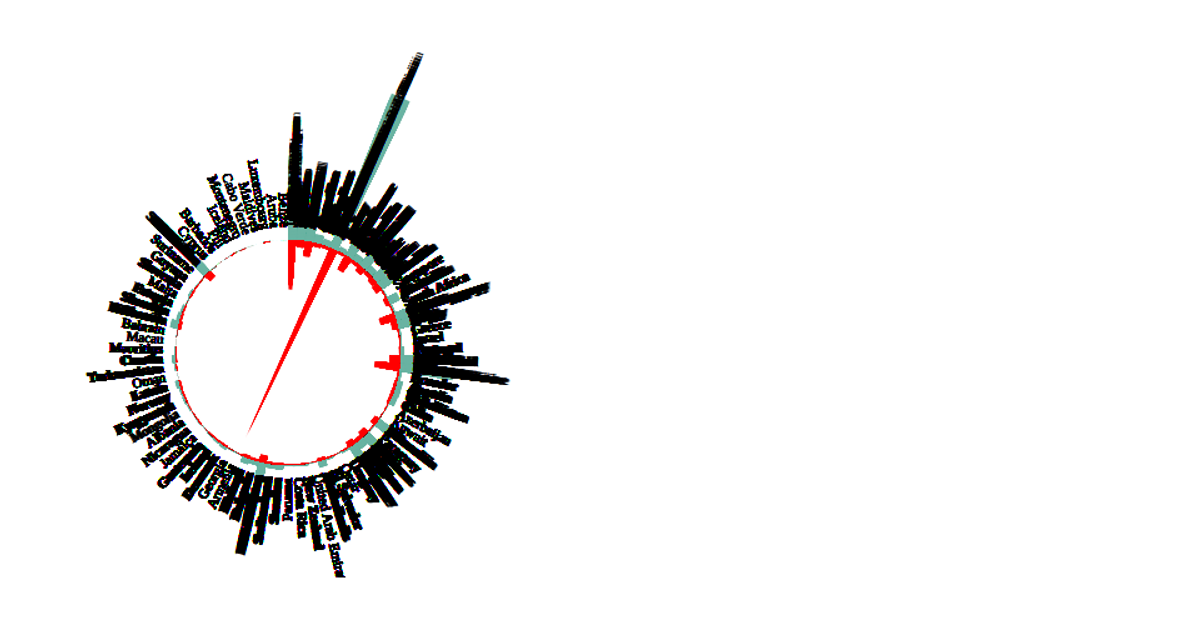
This scatter plot visualizes global suicide rates from a CSV dataset, with interactive dropdown menus to switch the quantitative variables mapped to the x- and y-axes. The SVG circles animate their positions via `transition().duration(10)` with per-circle delays, while axis transitions update when the selection changes. Built with D3 v6, the chart uses `scaleLinear`, `scalePoint`, `axisLeft`, and `axisBottom` to render the axes and `dispatch` for menu change events. The duration is intentionally short, making circle movements appear near-instant.
AI-generated descriptionAdd Interaction
Shows the Suicide_Rates.csv.
MIT Licensed




Comments
Sign in to join the discussion.