🌍 Public
Making a bar chart
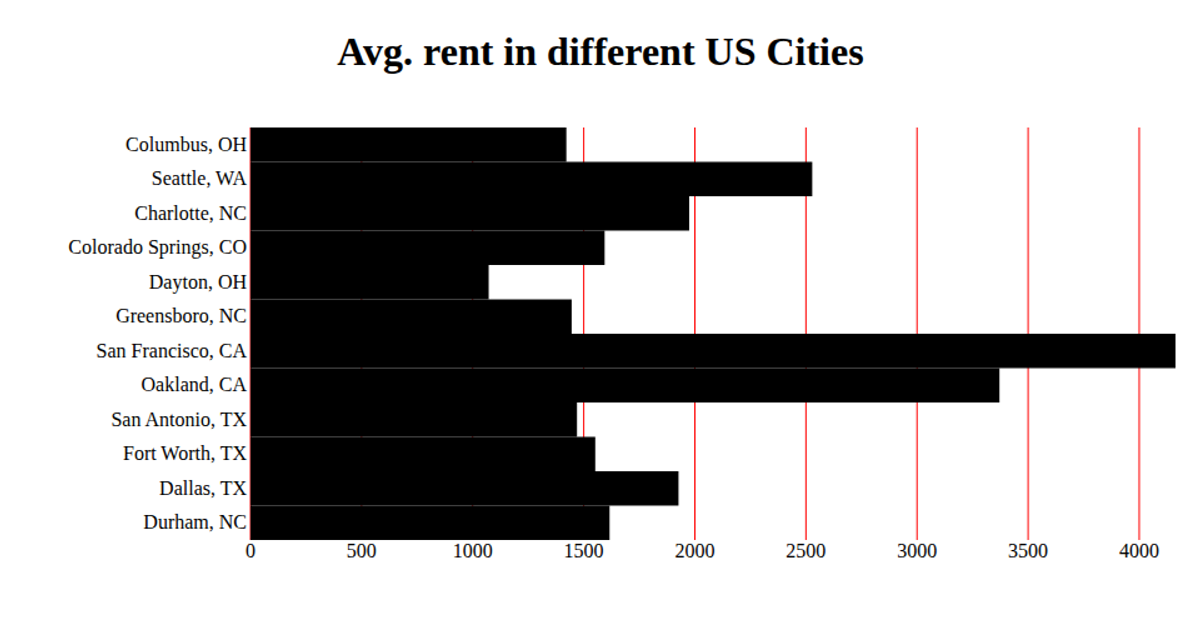
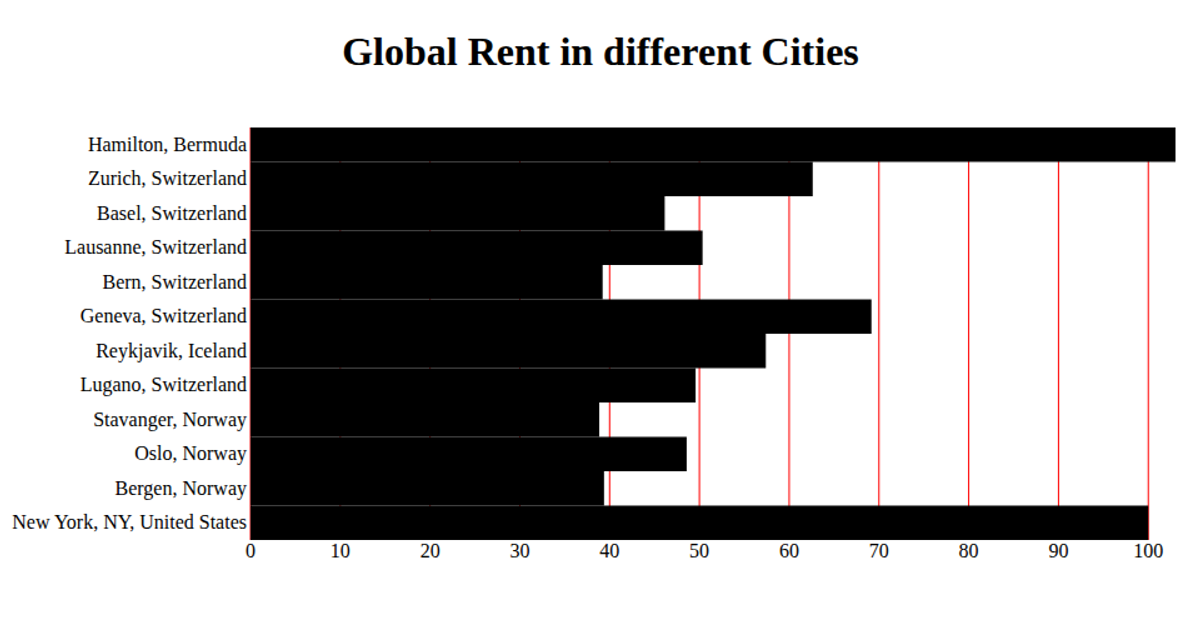
This bar chart displays median monthly rent for Berkeley ZIP codes, with horizontal bars sorted by postal code. The visualization uses d3.csv to load the data, d3.scaleBand and d3.scaleLinear to map ZIP codes and costs, and d3.axisLeft and d3.axisBottom with custom tick formatting. Rendered as SVG, the chart applies margins, removes default axis lines, and labels the x-axis as "Rent" with a title above the plot.
AI-generated descriptionMIT Licensed






Comments
Sign in to join the discussion.