🌍 Public
Color Experiments
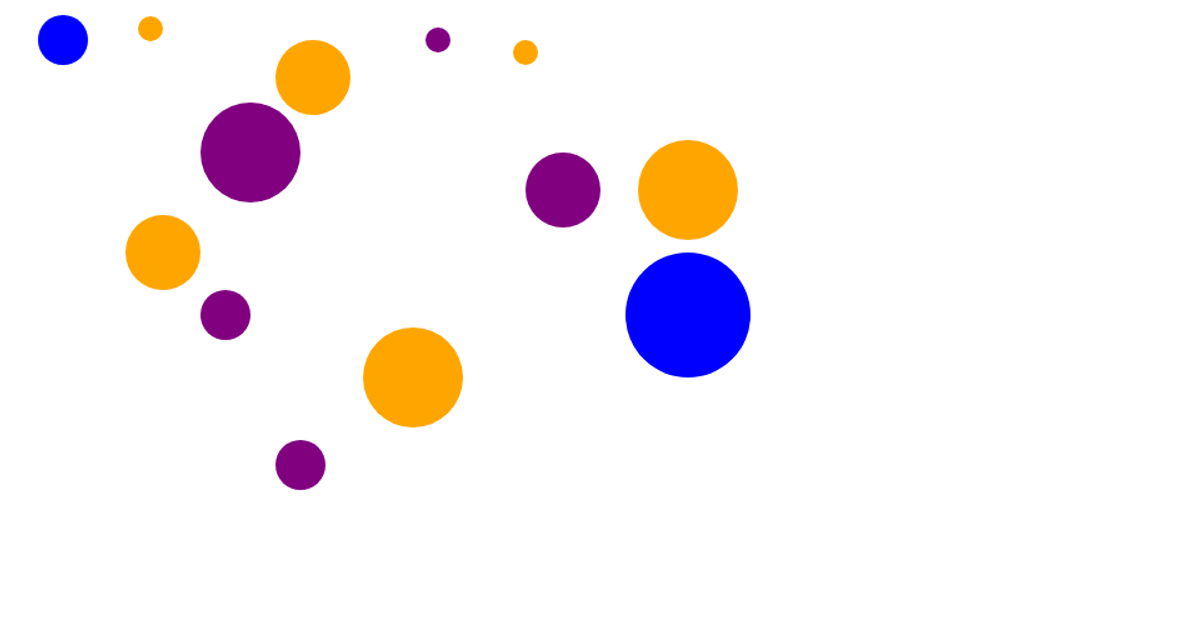
This example generates 150 circles at random positions across the full browser viewport. Each circle receives a random radius, opacity, and a fill color selected from a procedurally generated RGB range using D3’s `select` and `join` methods. The SVG renders with a 13em body font, displaying the title "Color Experiments" at the top of the page. The data is constructed in plain JavaScript with no external dataset.
AI-generated descriptionA demonstration of how to start using D3 version 6.
MIT Licensed



Comments
Sign in to join the discussion.