🌍 Public
Fork of Loading and Parsing data with CoronovirusData
KK V VINITHA
Last edited Feb 28, 2022
Created on Feb 28, 2022
Forked from Loading and Parsing data with CoronovirusData
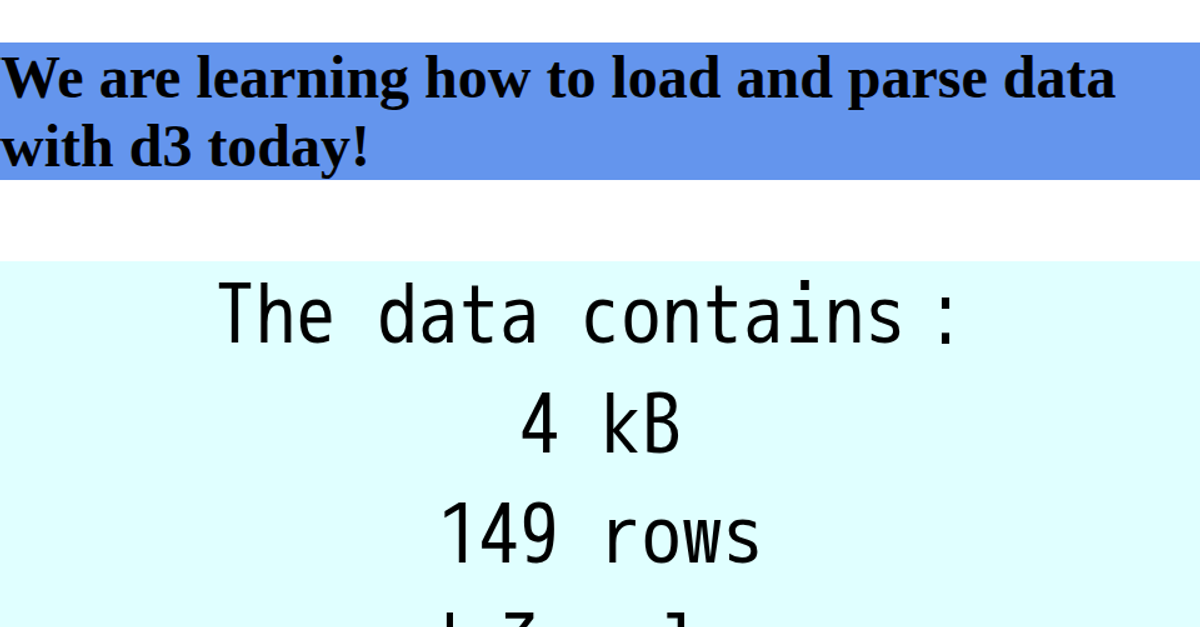
This example displays a decorative SVG illustration of a cat and a placemat, with a styled header and an information panel. The page loads coronavirus data from a CSV file hosted on GitHub Gists using the `d3.csv` API, then computes and displays the dataset’s size in kilobytes, row count, and column count. The information is rendered into an HTML `<pre>` element, styled with bold, oblique, small-caps text on a red background. The page structure uses plain HTML with CSS for layout, while D3 v7 handles the data fetching and parsing.
AI-generated descriptionA bare minimum HTML page demonstrating use of CSS and JavaScript.
See also React Starter.
MIT Licensed



Comments
Sign in to join the discussion.