🌍 Public
First
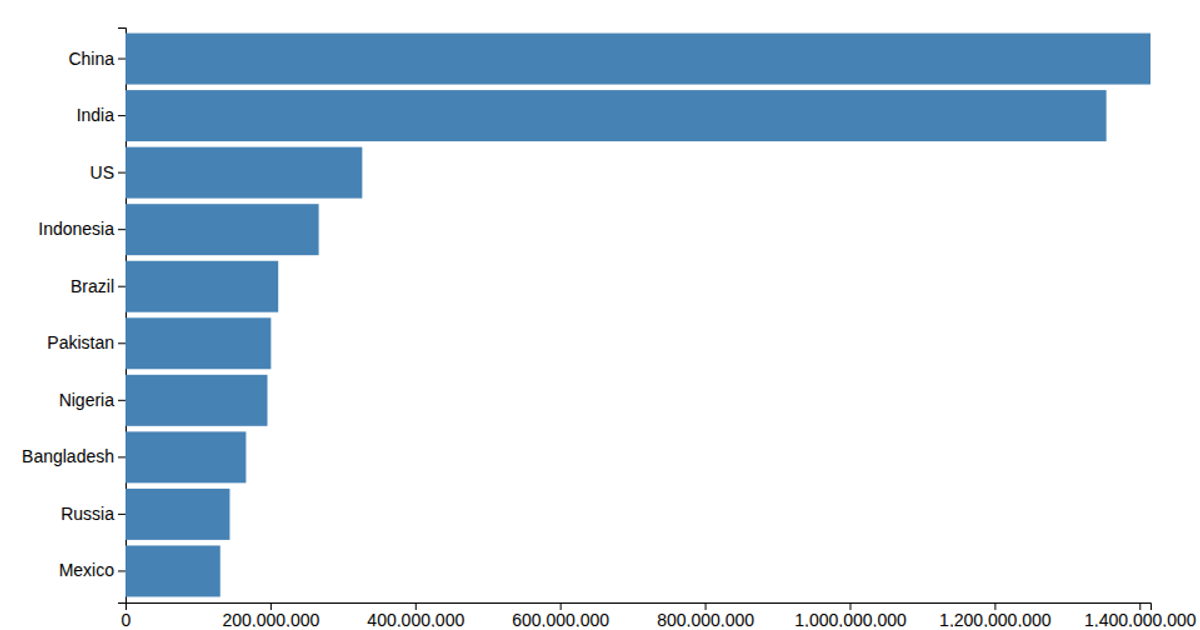
A bar chart displays population figures for ten countries, with countries listed vertically and population encoded by horizontal bar length. The visualization uses D3 v5’s `csv`, `scaleLinear`, `scaleBand`, `axisLeft`, and `axisBottom` to load data, map values, and render axes. Orange rectangles are drawn in an SVG container with margins, positioned via the band scale’s y-coordinates and width from the linear scale.
AI-generated descriptionMIT Licensed




Comments
Sign in to join the discussion.