🌍 Public
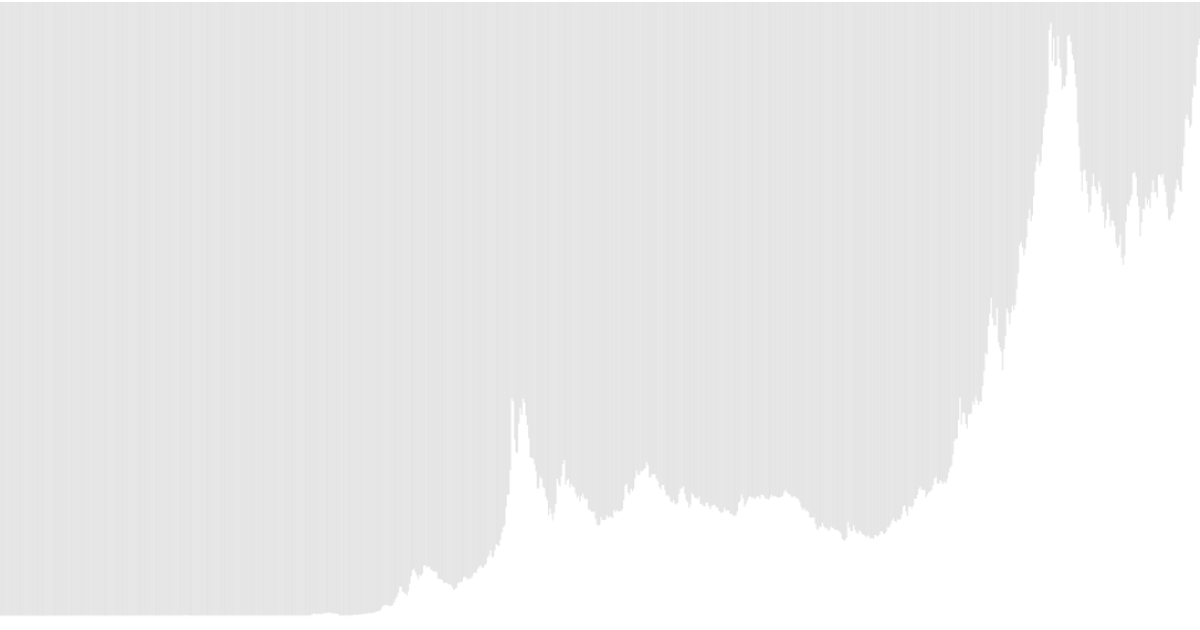
Monthly Price of Gold since 1950
The visualization displays the monthly price of gold from 1950 onward as a series of vertical bars, with height representing the dollar price and horizontal position encoding time. It uses D3 v6 to load the CSV data, parse dates with `timeParse('%Y-%m')`, and map values through `scaleTime` and `scaleLinear` before appending SVG rectangles. The data comes from the gold-prices dataset hosted on Datahub.
AI-generated descriptionMIT Licensed




Comments
Sign in to join the discussion.