🌍 Public
BMW Simple Bar Chart
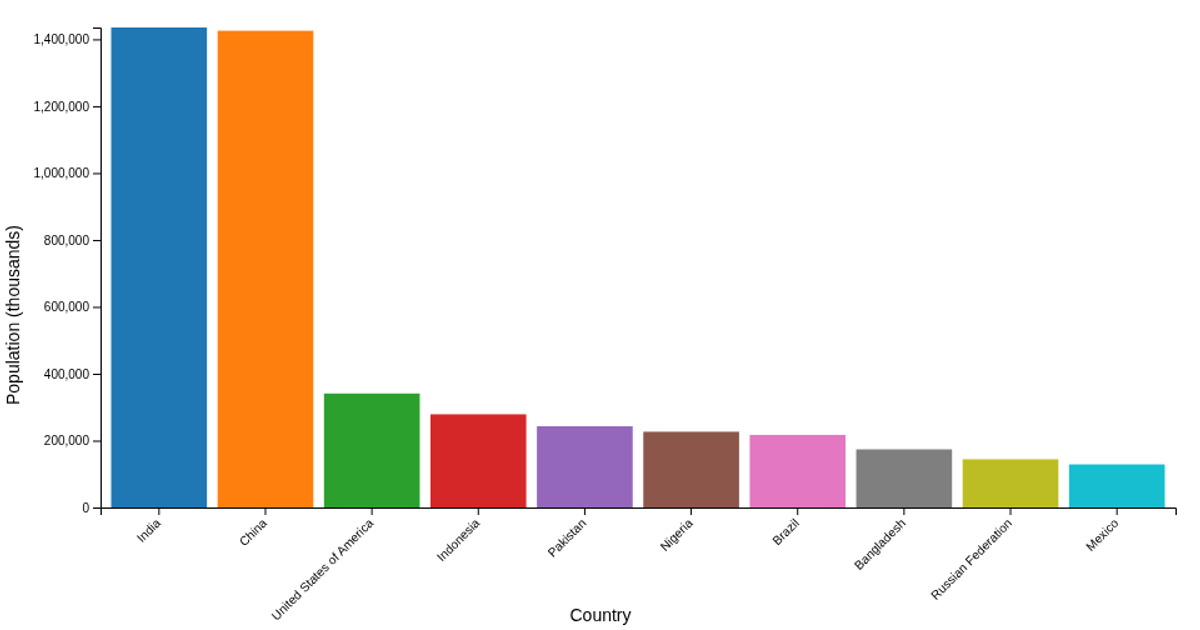
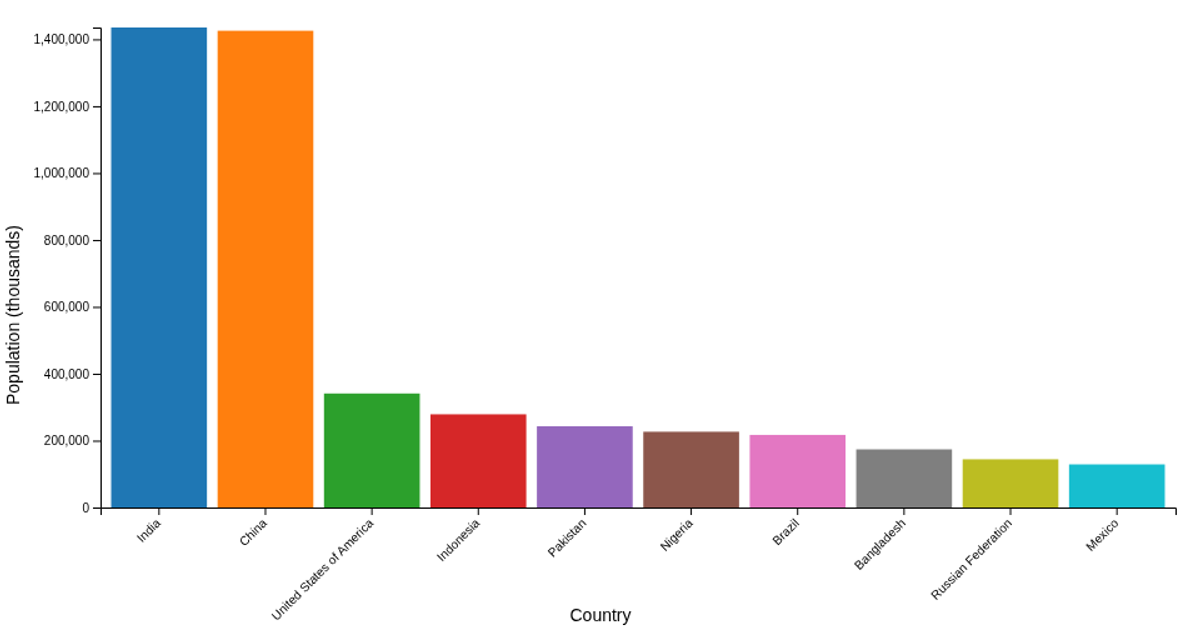
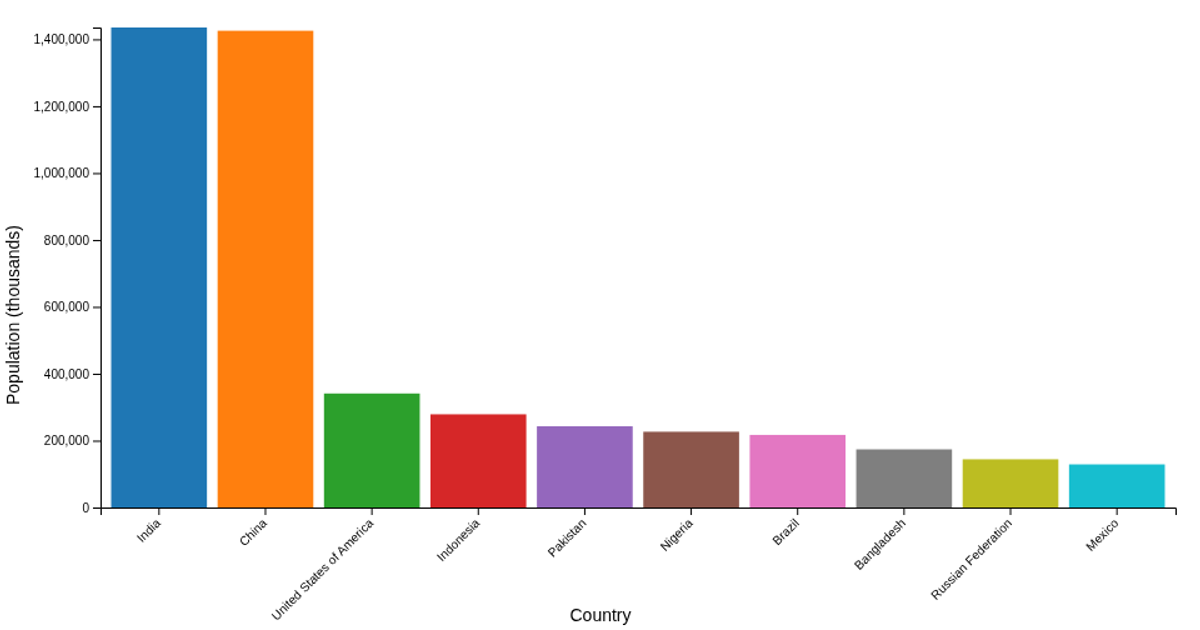
This example shows a bar chart of the top 10 countries by population, with clickable bars that highlight in orange when selected. The visualization loads data from a CSV of UN population estimates, filtering for country-level records and sorting by total population. Built with D3 v7 and d3-rosetta, it uses `scaleBand` and `scaleLinear` for positioning, `axisBottom` and `axisLeft` for axes, and a unidirectional data flow pattern managed by `createStateField`. Clicking a bar toggles its selection state, which re-renders the chart with the updated highlight.
AI-generated descriptionMIT Licensed




Comments
Sign in to join the discussion.