🌍 Public
ICE-5 webpage
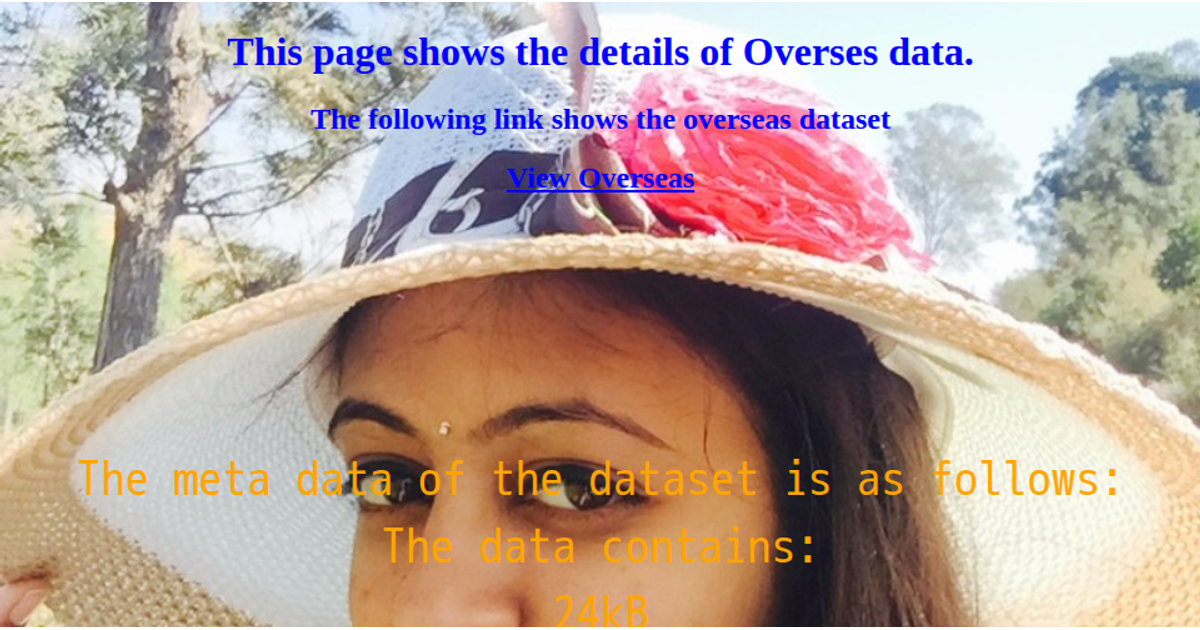
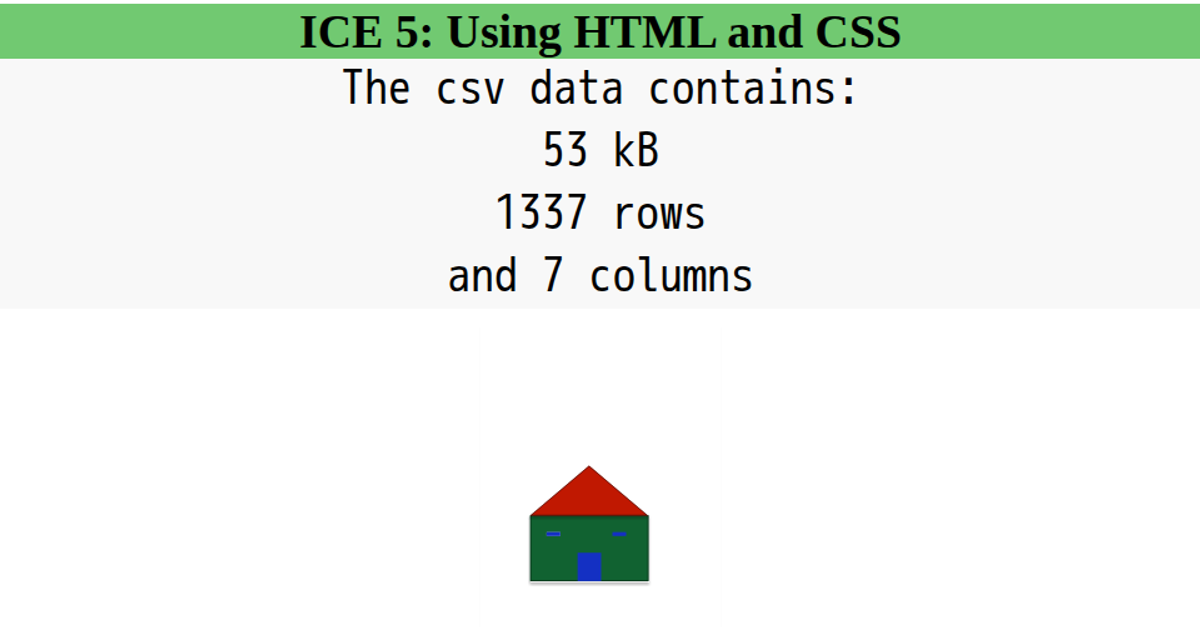
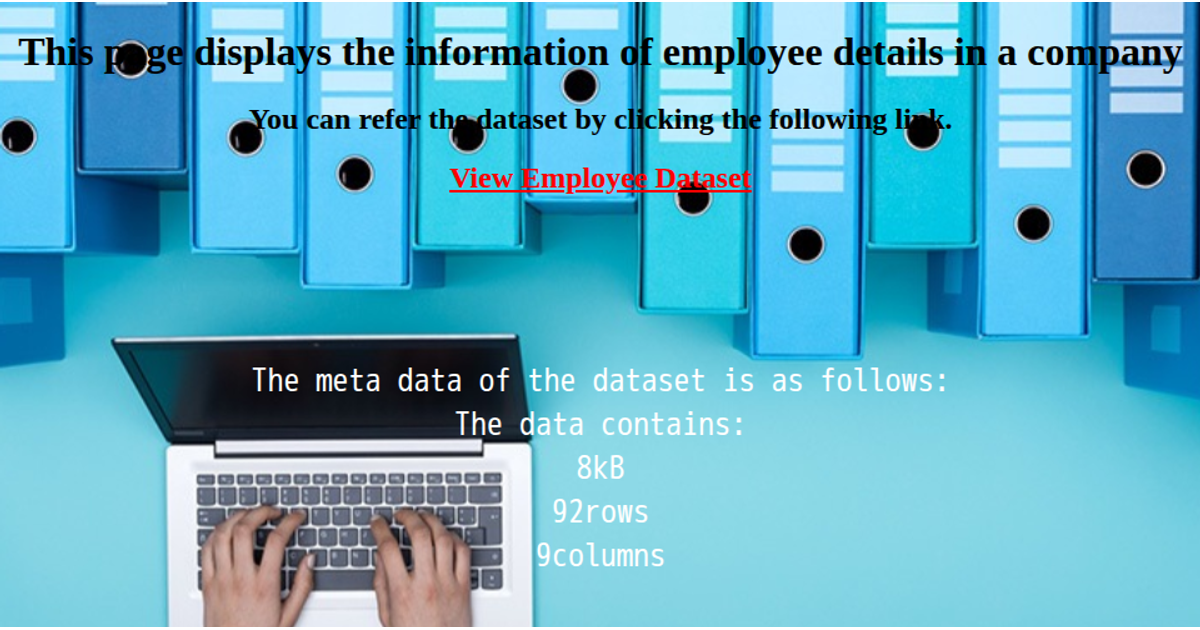
This example presents the Forbes company rankings for 2022 as a styled webpage. The page displays the dataset’s metadata, including its size in kilobytes, row count, and column count. It uses D3.js v7’s `d3.csv` to fetch and parse data from a remote CSV file hosted on GitHub, then calculates the metadata using `d3.csvFormat` and updates the DOM via `textContent`. The page features custom CSS styling with a background image and navigation links.
AI-generated descriptionA bare minimum HTML page demonstrating use of CSS and JavaScript.
See also React Starter.
MIT Licensed



Comments
Sign in to join the discussion.