🌍 Public
Vibe Check with Gradients
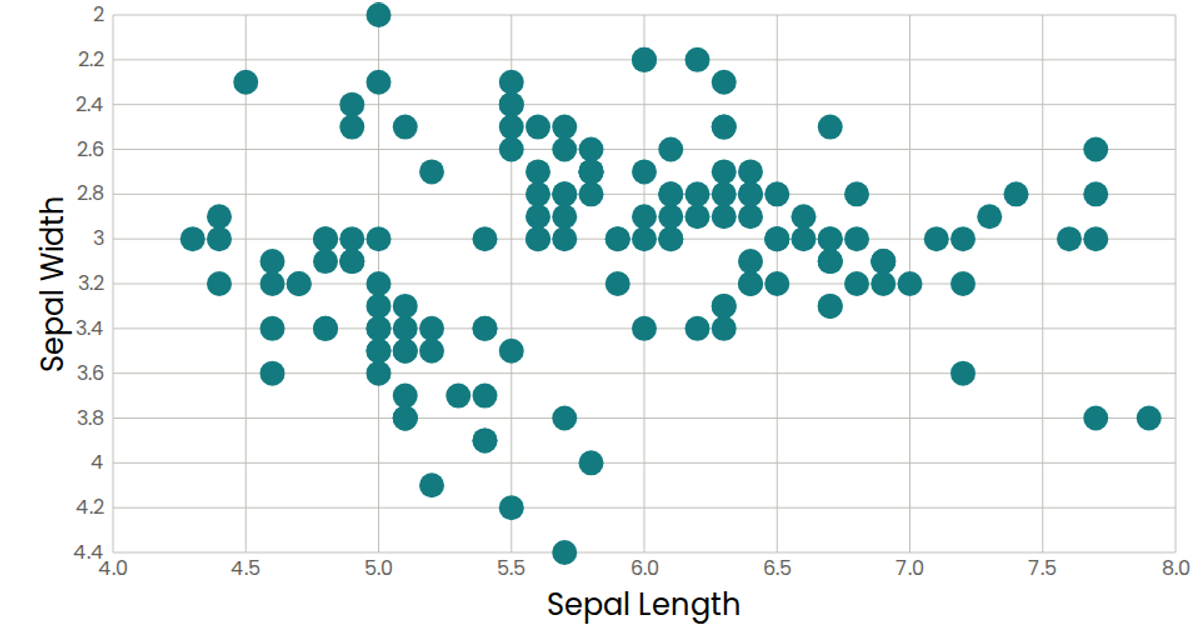
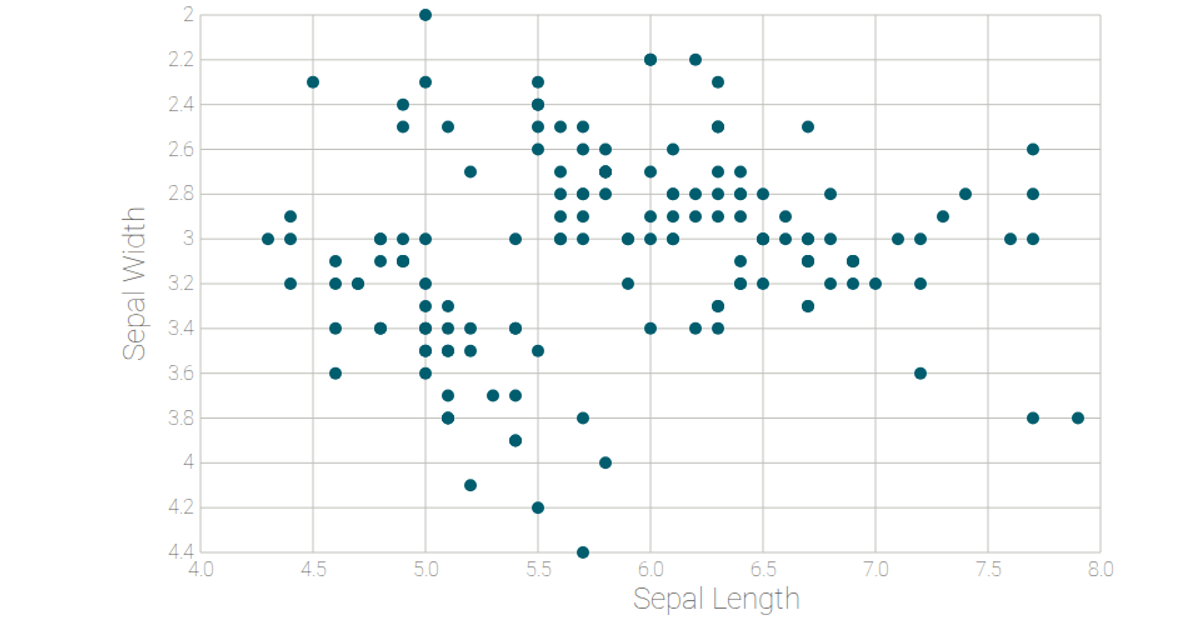
This visualization plots the classic Iris dataset as a scatter plot, with sepal length on the x-axis, sepal width on the y-axis, and petal length mapped to circle radius. Data loads from CSV via d3.csv, while React manages the SVG lifecycle. D3’s scaleLinear and extent compute the scales, and axisBottom/axisLeft render the styled axes. A custom SVG filter with feGaussianBlur and feMerge adds a soft glow effect to the semi-transparent blue circles.
AI-generated descriptionMIT Licensed


Comments
Sign in to join the discussion.