🌍 Public
Tree Graph Alankruth
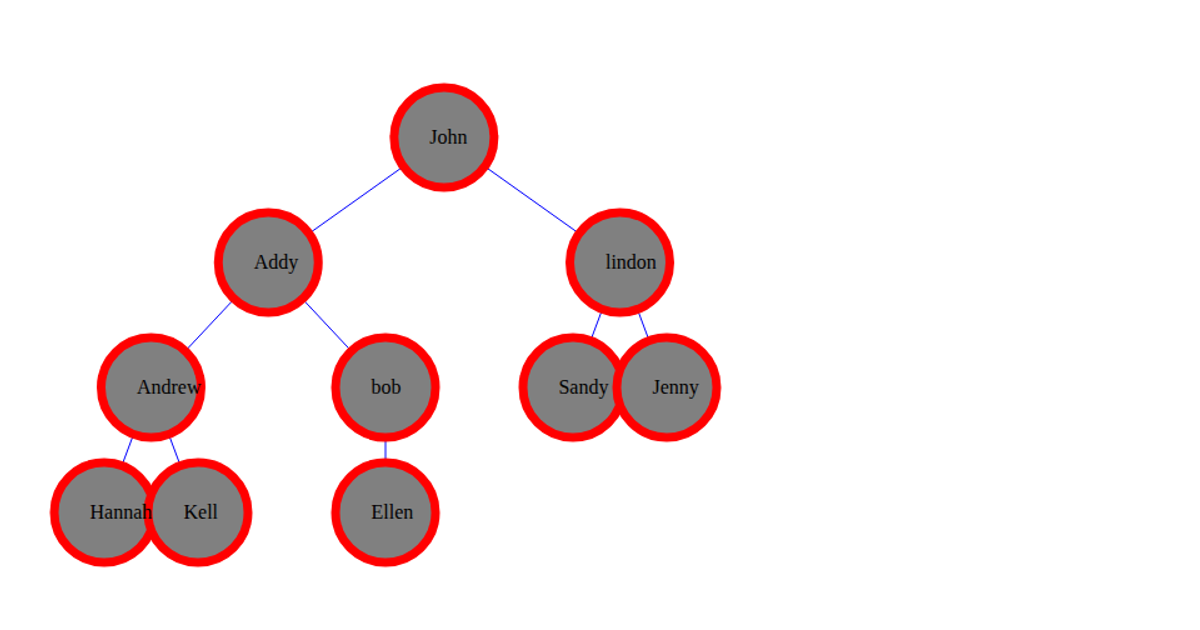
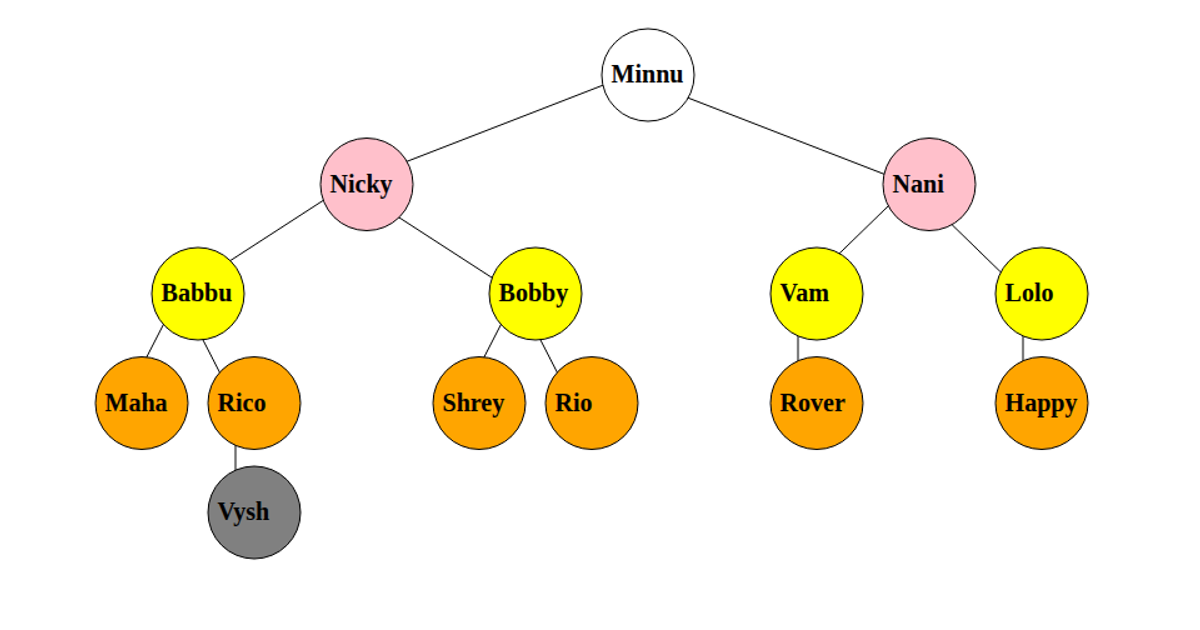
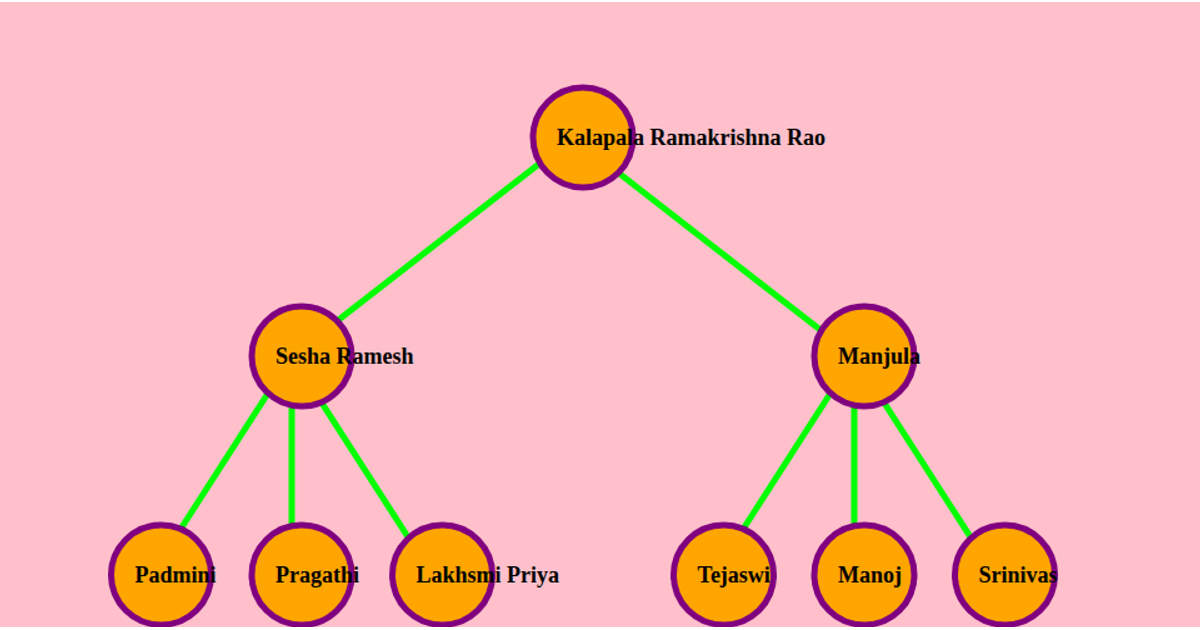
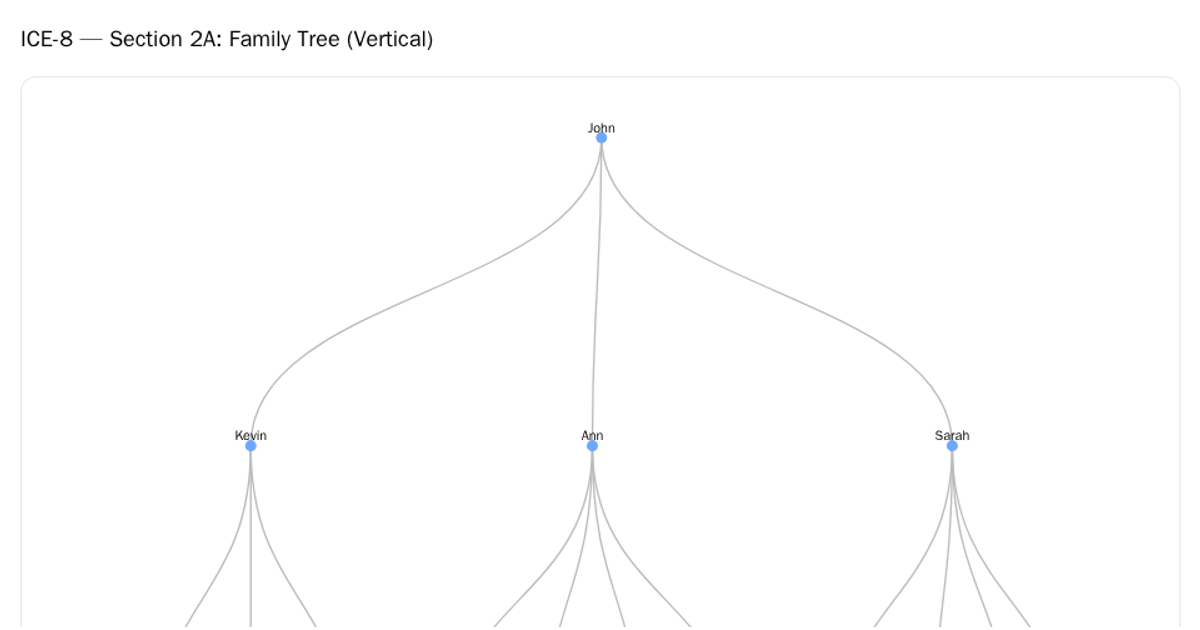
A tree graph displays hierarchical family connections, with each person as a yellow circle and black lines representing parent-child links. The data, a small hardcoded list of names, is processed through the `d3.stratify()` and `d3.tree()` APIs to compute layout positions. SVG elements render the structure, with circles and text nodes drawn within a group. Animation is applied through the `transition()` API, which animates the path lines from the source to the target and staggers text appearance based on depth, creating a dynamic reveal of the tree.
AI-generated descriptionMIT Licensed




Comments
Sign in to join the discussion.