🌍 Public
Scatter Plot
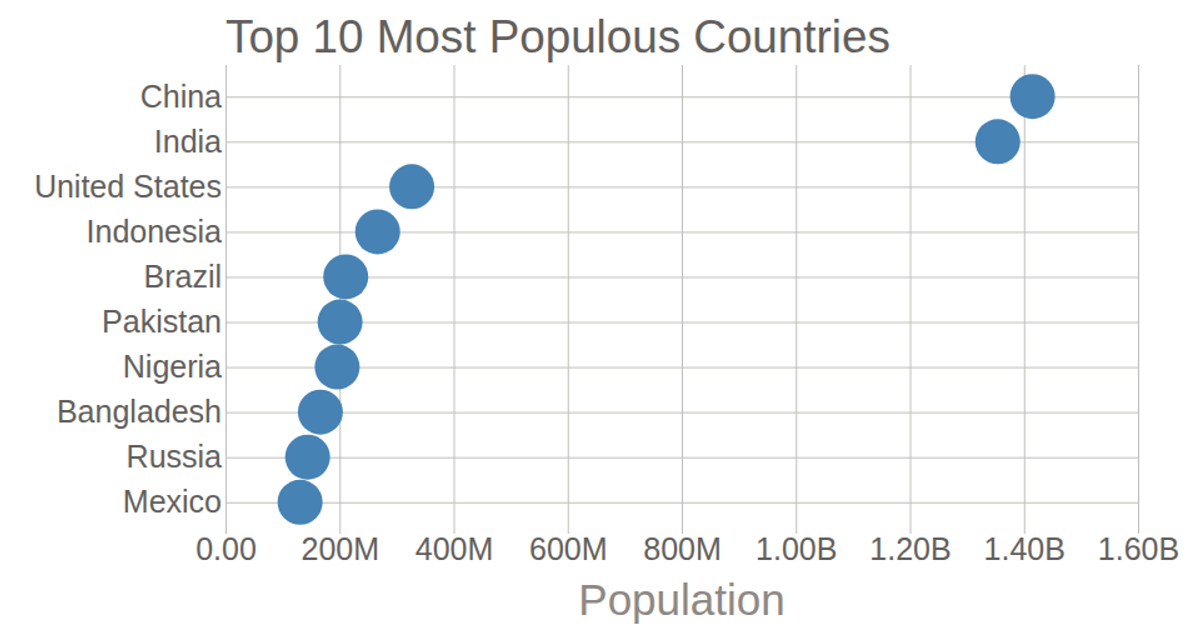
This scatter plot displays the population of the ten most populous countries, using a linear scale for population and a point scale for country names. The code imports specific D3 v5 functions, including `scaleLinear`, `scalePoint`, `axisBottom`, and `axisLeft`, to render the axes and circles as SVG elements. Population data comes from a CSV file based on 2018 UN estimates. The chart applies a custom tick formatter that abbreviates population values, converting billions to "B" for readability.
AI-generated descriptionThis bar chart shows population of the top 10 most populus countries. The data come from the year 2018 estimmate in World Population by UN
MIT Licensed




Comments
Sign in to join the discussion.