🌍 Public
custom chart v2.2
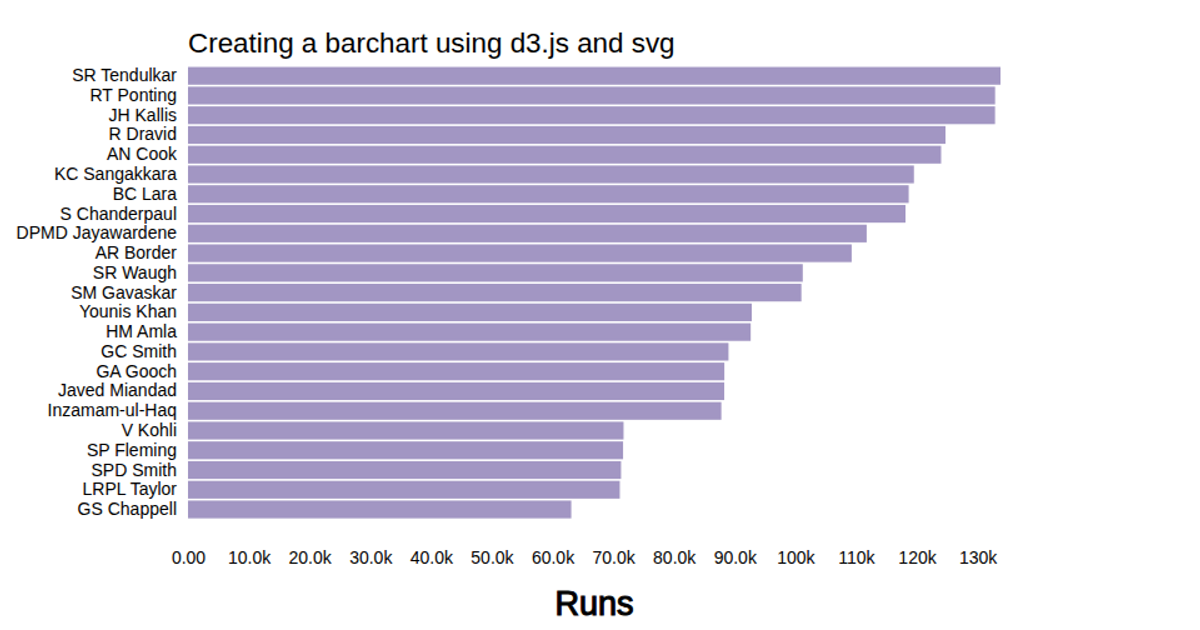
This chart displays cricket batting data, mapping each player’s innings as a horizontal bar positioned by their first ball faced and height by runs scored before them. The SVG rendering uses d3.scaleLinear for both axes, d3.axisLeft and d3.axisBottom for scales, and d3.csv to load the dataset. Rectangles encode innings length, runs, and cumulative runs, with axis ticks showing balls faced.
AI-generated descriptionMIT Licensed


Comments
Sign in to join the discussion.