🌍 Public
Activity 6_Task 1
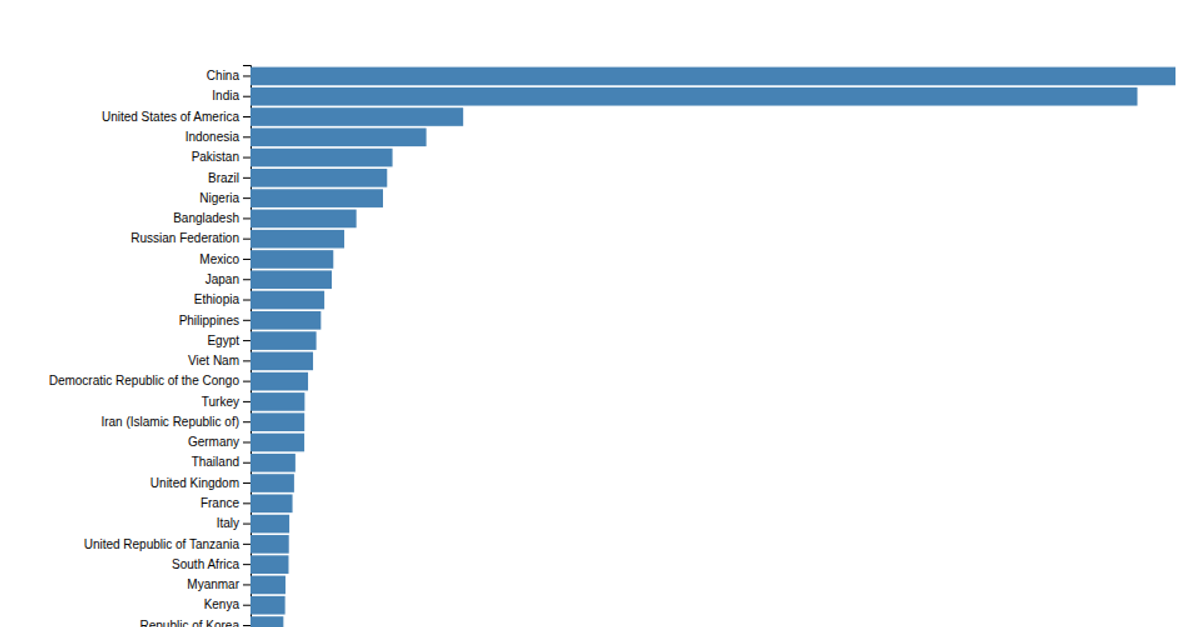
A horizontal bar chart displays 2020 population estimates for the top 30 countries from a CSV dataset. It shows population values as steelblue bars with formatted labels, using a linear scale for the x-axis and a band scale for countries on the y-axis. Built with D3 v7 and rendered as SVG, the code uses `d3.csv`, `scaleLinear`, `scaleBand`, `d3.axisBottom`, and `d3.axisLeft`.
AI-generated descriptionMIT Licensed







Comments
Sign in to join the discussion.