🌍 Public
Barchart with D3.js
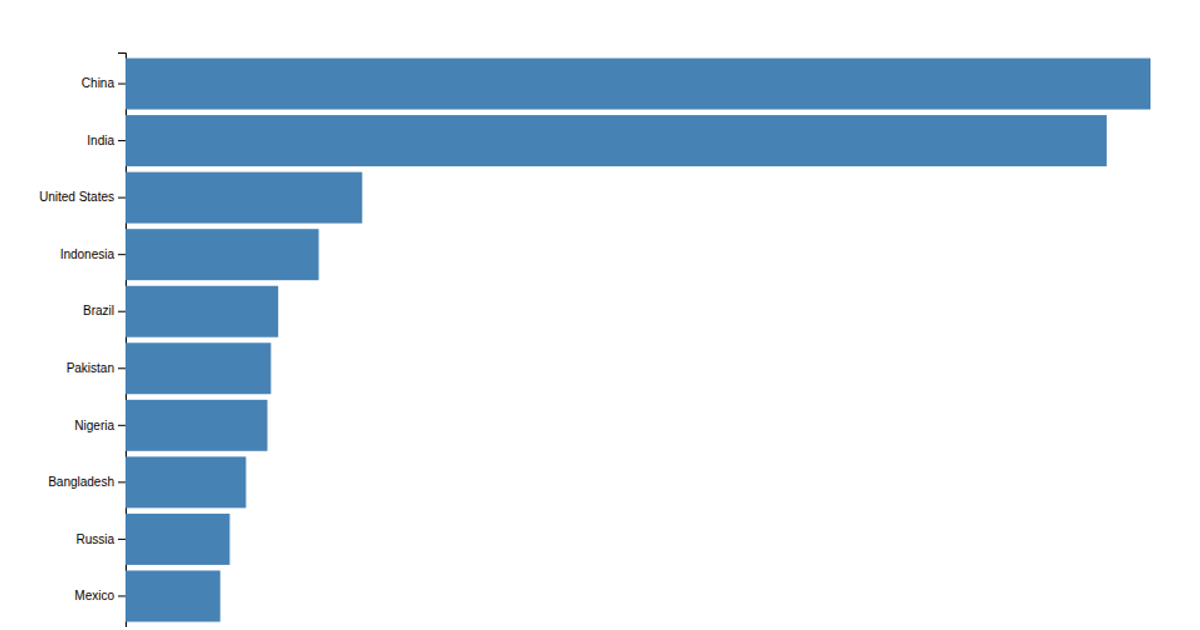
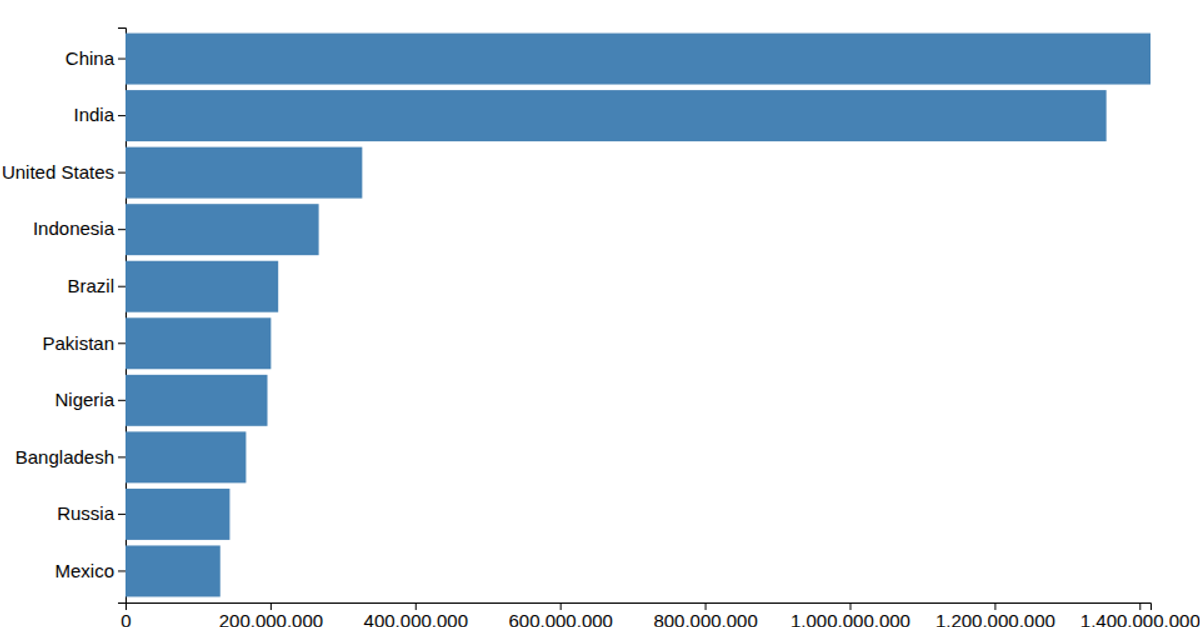
This bar chart displays the populations of ten countries, from China’s 1.4 billion to Mexico’s 131 million. The data, loaded from a CSV file, is rendered as horizontal bars using D3.js v5. The visualization uses `d3.scaleLinear` for the x-axis, `d3.scaleBand` for the y-axis, and `d3.axisLeft` and `d3.axisBottom` to draw the axes. Each bar’s width is proportional to its population value, with steel-blue rectangles drawn in an SVG container.
AI-generated descriptionMIT Licensed



Comments
Sign in to join the discussion.