🌍 Public
Fork of Area chart
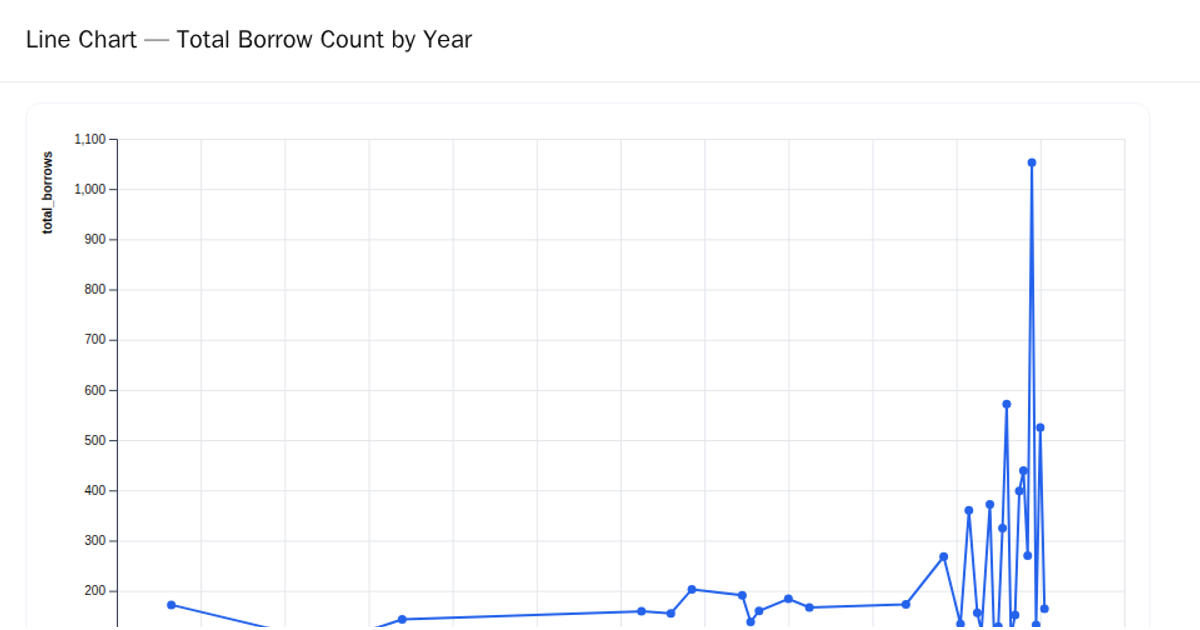
This area chart visualizes the total borrow count of library books per year. The data is loaded from a CSV file hosted on GitHub and aggregated by year. The chart uses a soft blue filled area with a line overlay and circular markers to emphasize data points. Hovering over a point reveals a tooltip. Built with D3 v7, it uses methods like `d3.area`, `d3.line`, `d3.csvParse`, and `d3.rollup` to process the data and render SVG elements. Grid lines and labeled axes provide context for the temporal trends.
AI-generated descriptionMIT Licensed



Comments
Sign in to join the discussion.