🌍 Public
FP: House Sale Map
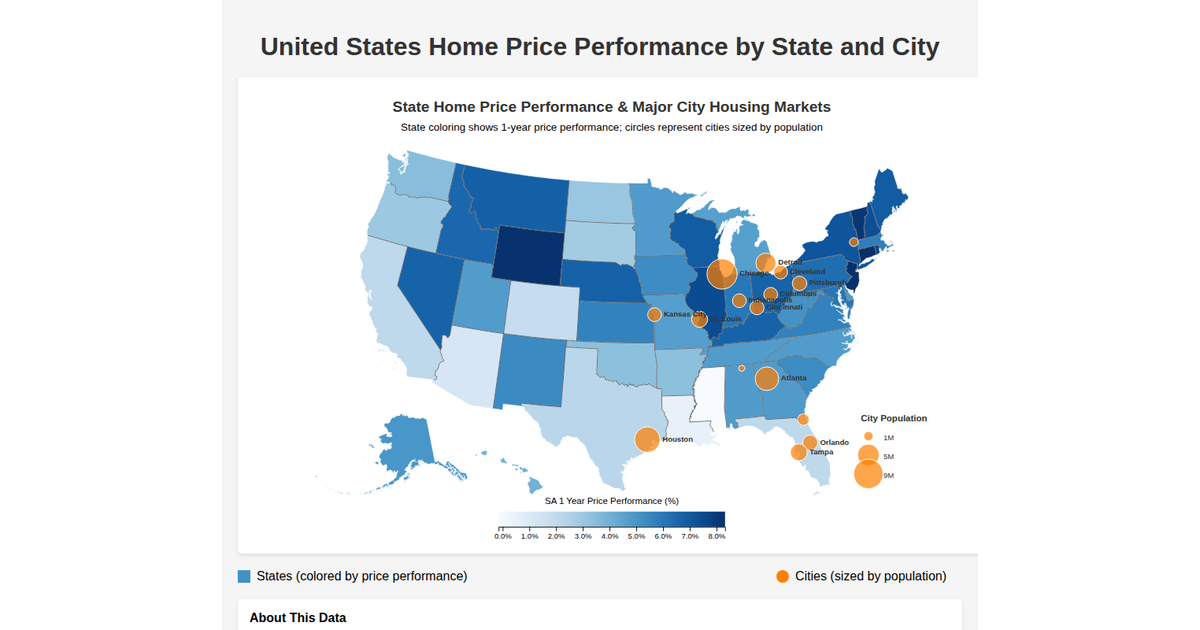
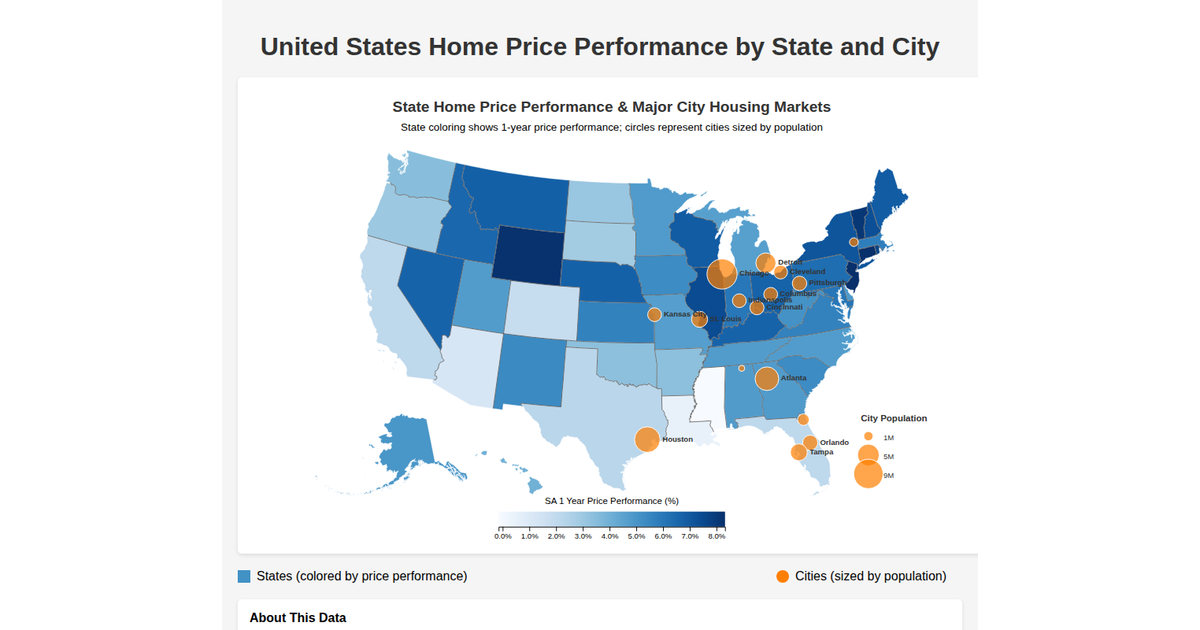
This example displays a map of the United States constructed with geographic data from the `us-atlas` TopoJSON, overlaid with white dots representing individual house sale prices from a CSV file. Using `d3.geoPath` and `d3.geoAlbersUsa` for the projection, it draws country outlines with black fills and white strokes, while also rendering graticule lines. The house coordinates are projected and plotted as circles, with all data fetched asynchronously and stored in a visual state managed by a setState callback.
AI-generated descriptionMIT Licensed





Comments
Sign in to join the discussion.