🌍 Public
Fork of Coronavirus Deaths Over Time by Country With Voronoi Overlay
Ccwlronald
Last edited Nov 4, 2021
Created on Nov 4, 2021
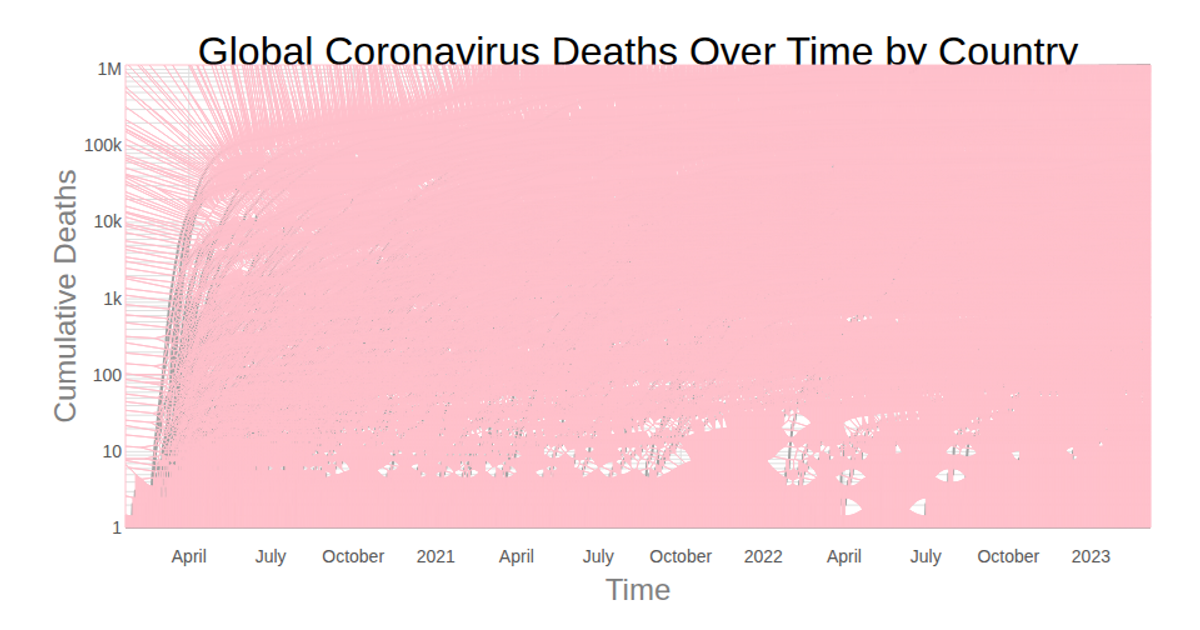
This visualization displays the cumulative number of COVID-19 deaths over time for each country, with a Voronoi overlay enabling interactive highlighting. A log-scaled y-axis and time-scaled x-axis render the line chart, while the D3 Delaunay triangulation (`d3.Delaunay`) and Voronoi diagram compute proximity regions for each data point. Hovering a cell triggers a React state update, redrawing a country's line in bold black. Data is sourced from the Johns Hopkins CSSE COVID-19 dataset, rendered as SVG.
AI-generated descriptionLine chart of Coronavirus cases to date. Data from Johns Hopkins Coronavirus Dataset.
MIT Licensed


Comments
Sign in to join the discussion.