🌍 Public
World Population - Top 25 - Vega-Lite API Template
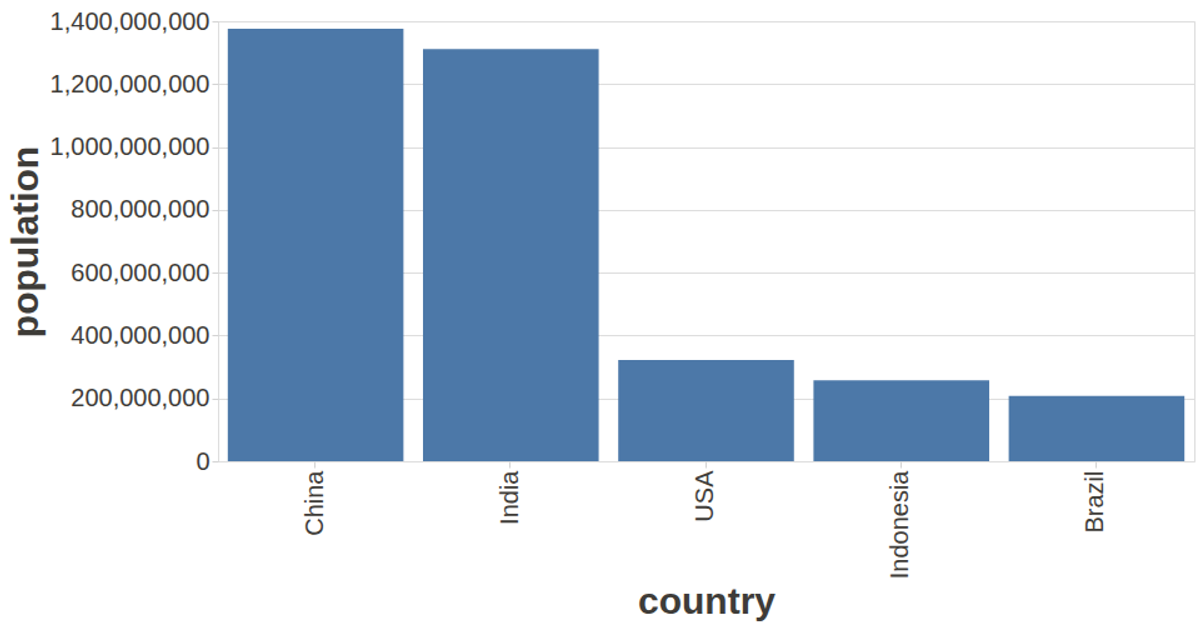
This visualization displays the top 25 countries by population, using a circle mark to encode population size while mapping median age to color and population density to the x-axis. The chart is built with the Vega-Lite API, which constructs a specification executed by Vega, with d3.csv loading the world-population dataset. A custom configuration adjusts axis styling and label sizes, while the tooltip handler from vega-tooltip provides interactive country names. The visualization automatically fits to the browser viewport via the autosize setting.
AI-generated descriptionA visualization constructed using the vega-lite-api.
MIT Licensed




Comments
Sign in to join the discussion.