🌍 Public
D3 Visualization tutorial
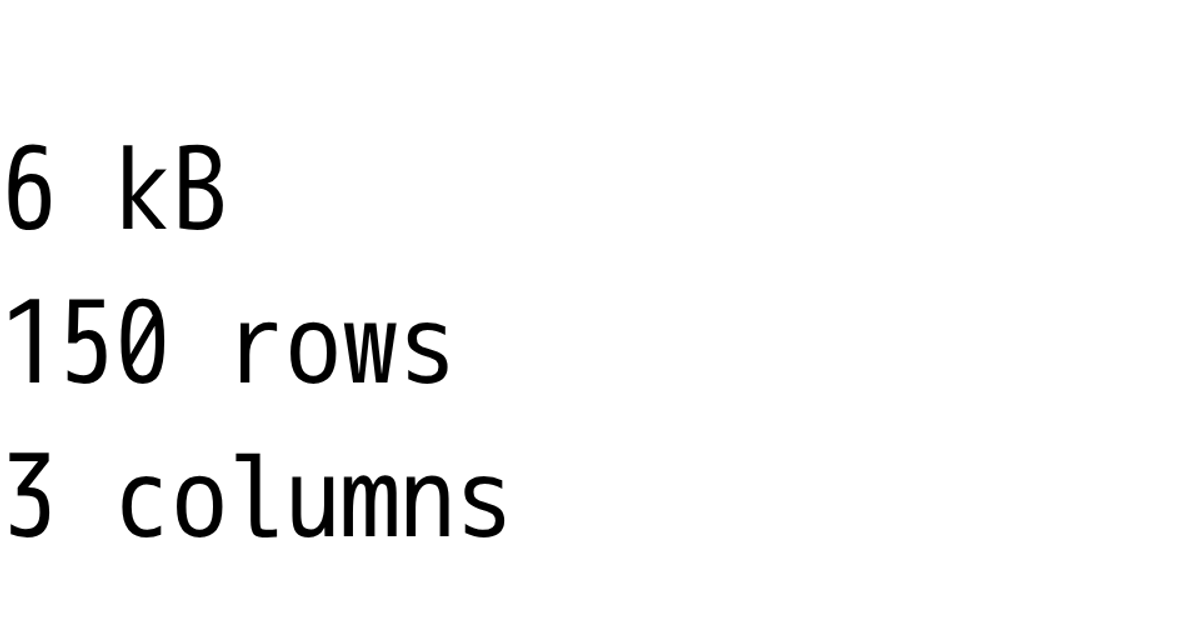
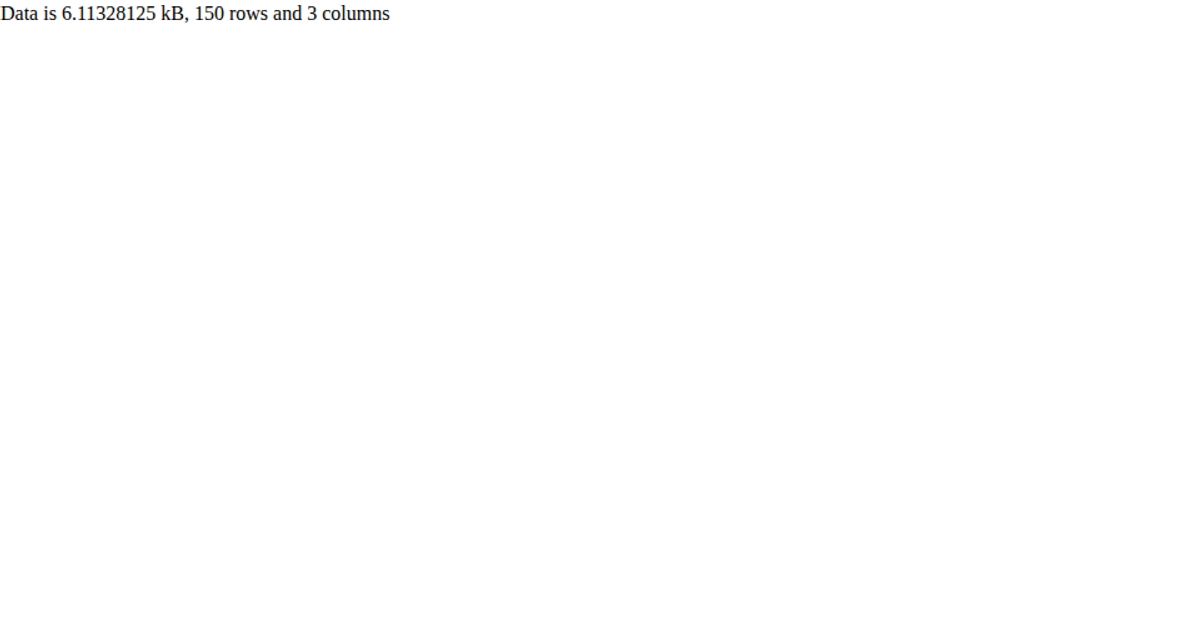
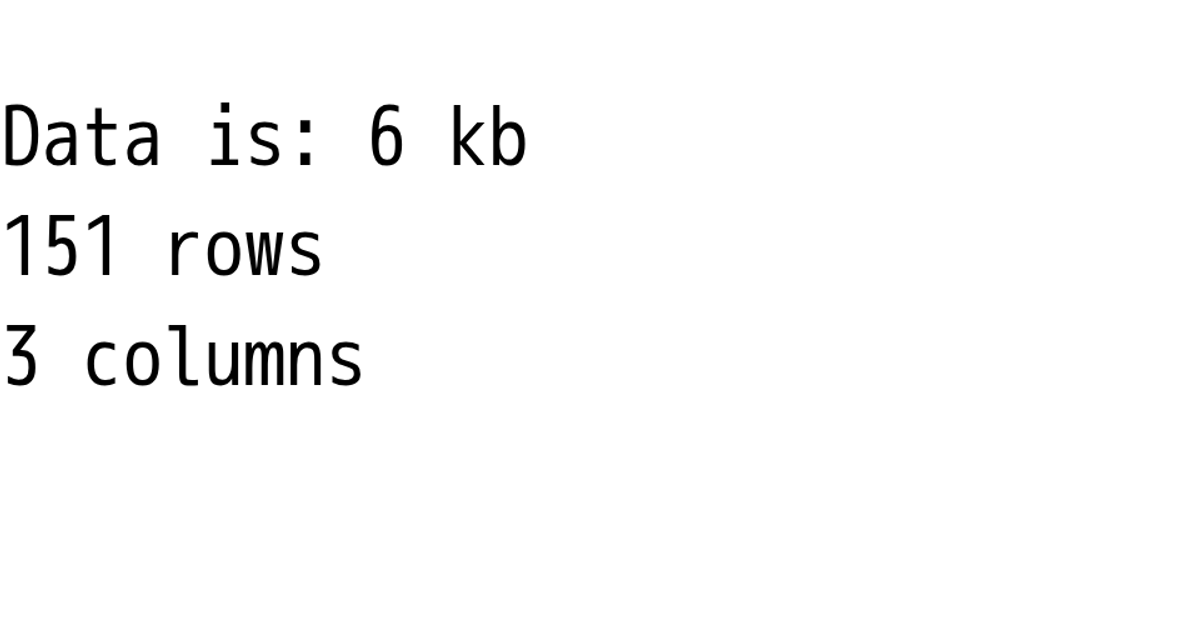
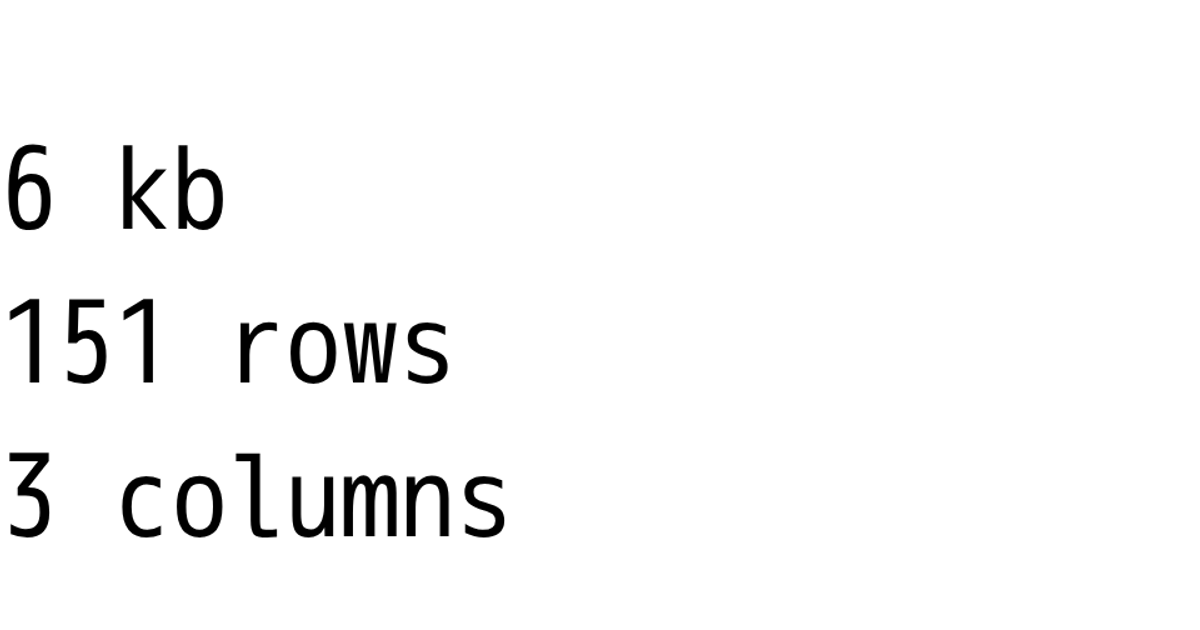
This example displays a simple text message, “Hello, D3 !”, in a web page using D3.js within a React framework. The visualization demonstrates the basic setup of a D3 project, loading data from a CSV file containing country population figures, though the data is not yet visualized. The code uses D3 v5’s `select` and `csv` APIs, along with vanilla JavaScript to update the DOM. The page is styled with a separate CSS file, and the React starter links to a VizHub template for further exploration.
AI-generated descriptionA bare minimum HTML page.
See also React Starter.
MIT Licensed



Comments
Sign in to join the discussion.