🌍 Public
Pie Chart
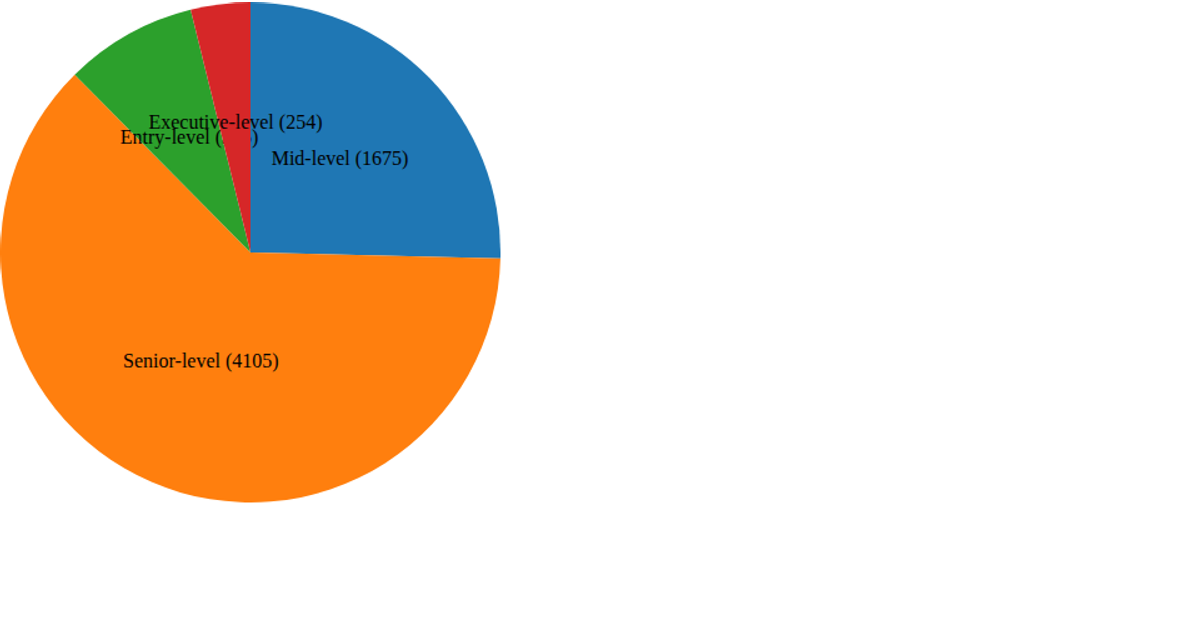
This pie chart visualizes the distribution of Supreme Court cases by issue area, using data from SCOTUS cases decided between 2018 and 2024. The chart displays the six most common issue areas, with each slice labeled by its case count and a legend identifying the corresponding category names. Built with D3 v7, the visualization uses `d3.csv`, `d3.rollups`, `d3.pie`, and `d3.arc` to process data and generate SVG paths, while `d3.scaleOrdinal` with `schemeCategory10` assigns slice colors. Labels are positioned using arc centroid calculations from a secondary `d3.arc` generator.
AI-generated descriptionMIT Licensed



Comments
Sign in to join the discussion.