🌍 Public
1 Question
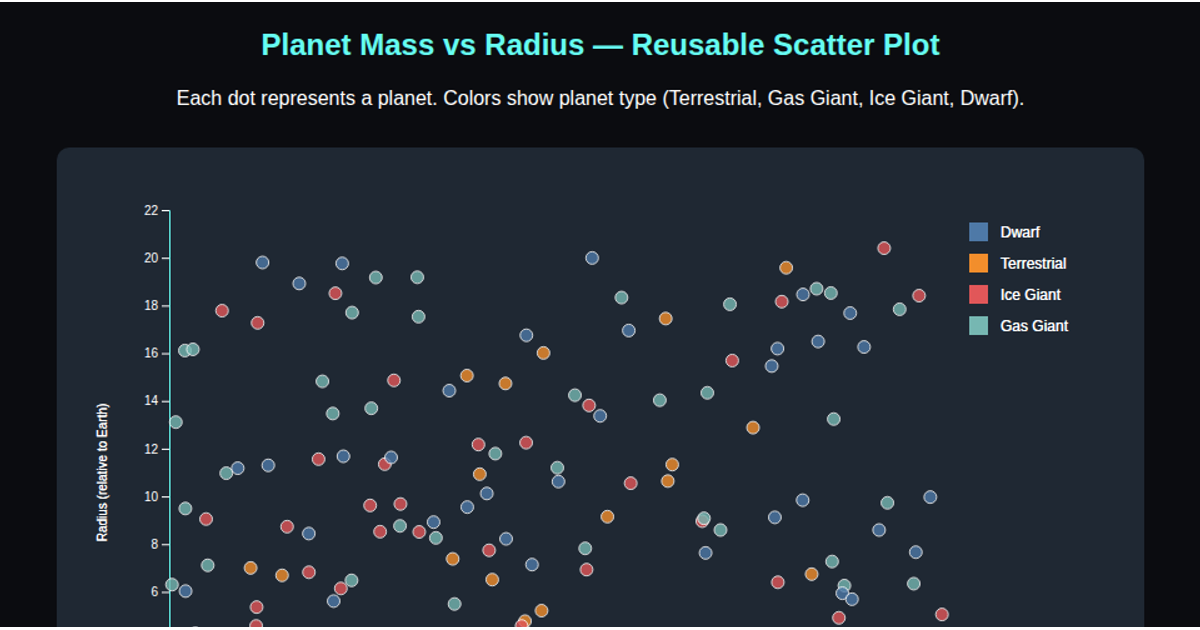
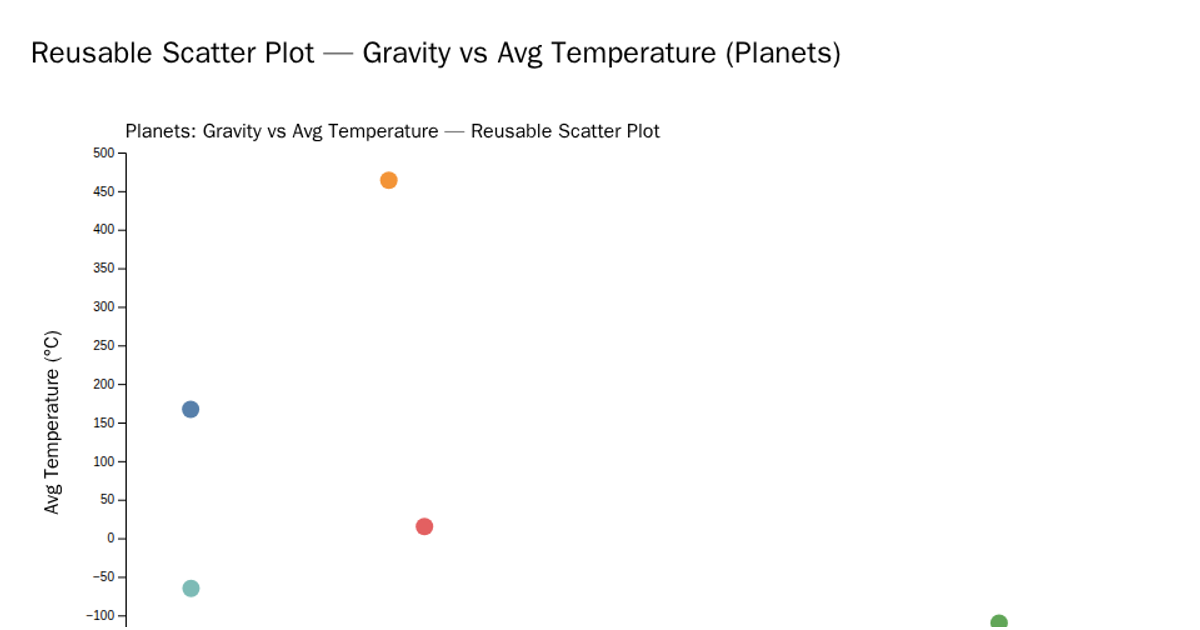
This interactive scatter plot visualizes the relationship between exoplanet mass and radius relative to Earth, with each dot colored by planet type (Rocky, Gaseous, Ice Giant). Built using D3.js v7, the reusable chart component employs `d3.scaleLinear` for axes, `d3.scaleOrdinal` with `d3.schemeTableau10` for color encoding, and includes hover tooltips via SVG `title` elements. The code loads data from a CSV file and demonstrates a modular pattern using `ScatterPlot()` factory functions with getter-setter methods for customizing x, y, and color accessors.
AI-generated descriptionMIT Licensed




Comments
Sign in to join the discussion.