🌍 Public
Working with tim
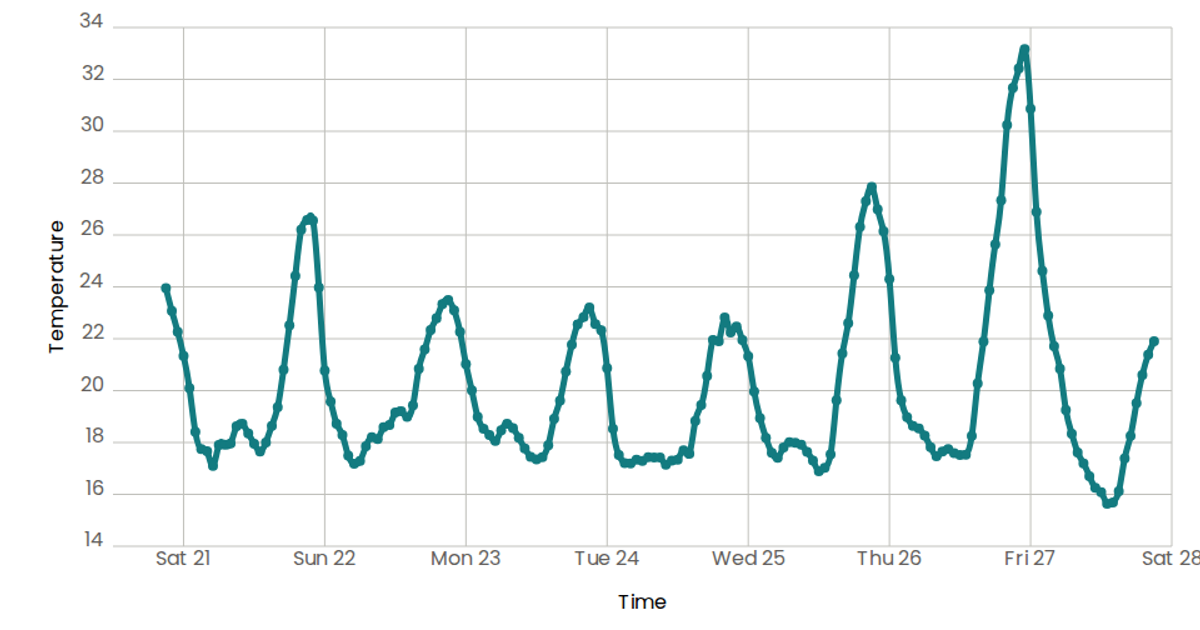
This example shows temperature measurements over time as a line chart with circular markers, using data from a CSV file of weekly San Francisco temperatures. The visualization is built with React and D3 v5, using `scaleTime` and `scaleLinear` for the axes and `d3.line` with `curveNatural` for the smooth path. SVG circles with embedded `<title>` elements provide native tooltips on hover, while custom React components `AxisBottom` and `AxisLeft` render the tick marks and labels.
AI-generated descriptionA scatter plot of Temperature over time.
MIT Licensed


Comments
Sign in to join the discussion.