🌍 Public
Fork of Vanilla D3Template
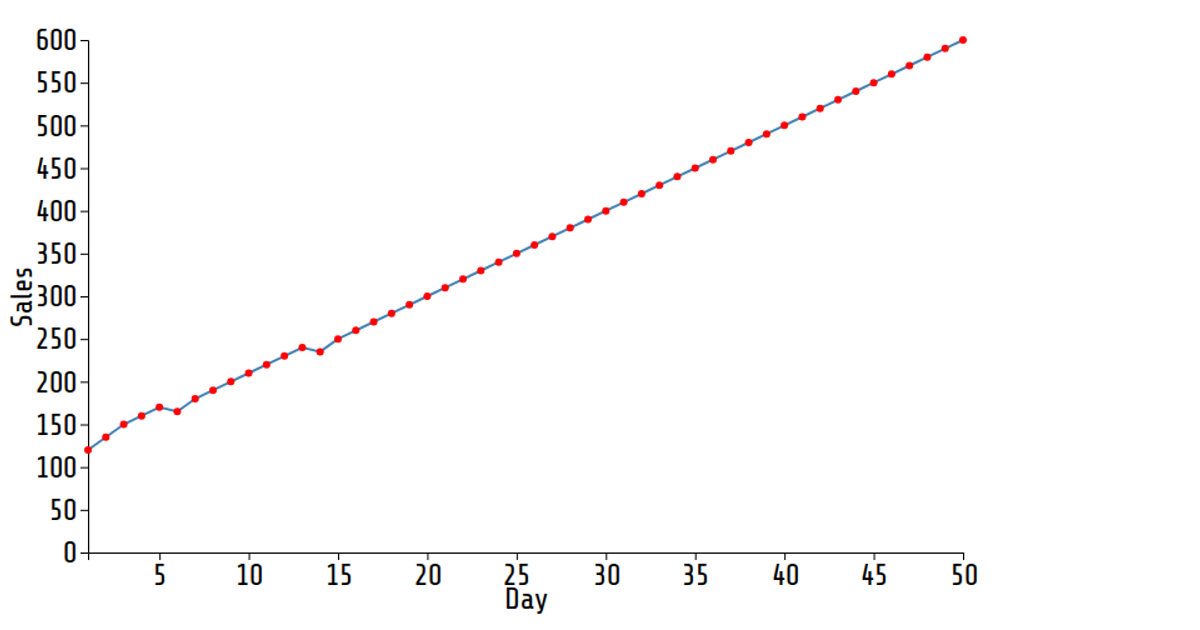
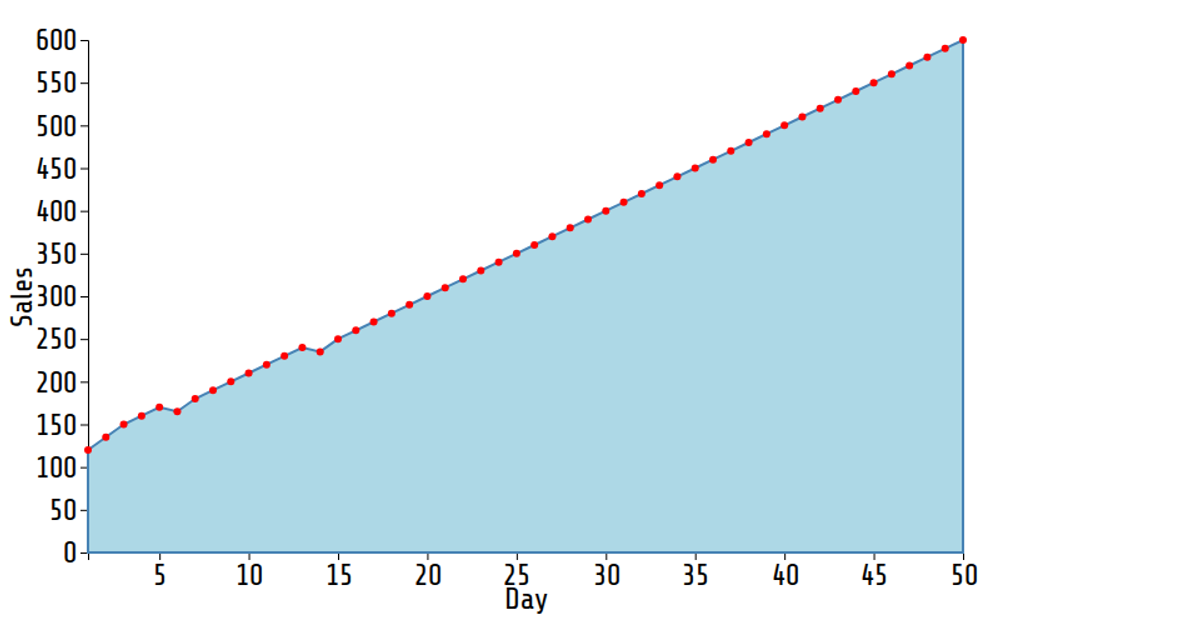
This gallery example presents a configurable scatter plot built with D3.js, mapping data dimensions from a CSV file to x, y, and color channels. The visualization loads data asynchronously via `d3.csv`, dynamically observes container dimensions, and renders an SVG with `renderScatterPlot`. It leverages the modular template’s `config` object to define field mappings and labels, and includes a hover interaction that updates state through `setHoveredColorValue`. The code demonstrates a reusable pattern for integrating data loading, dimension observation, and SVG rendering within a single visualization pipeline.
AI-generated descriptionMIT Licensed





Comments
Sign in to join the discussion.