🌍 Public
Fork of Coronavirus Deaths Over Time by Country With Voronoi Overlay
Ssultanmirzapydev
Last edited Aug 21, 2021
Created on Aug 21, 2021
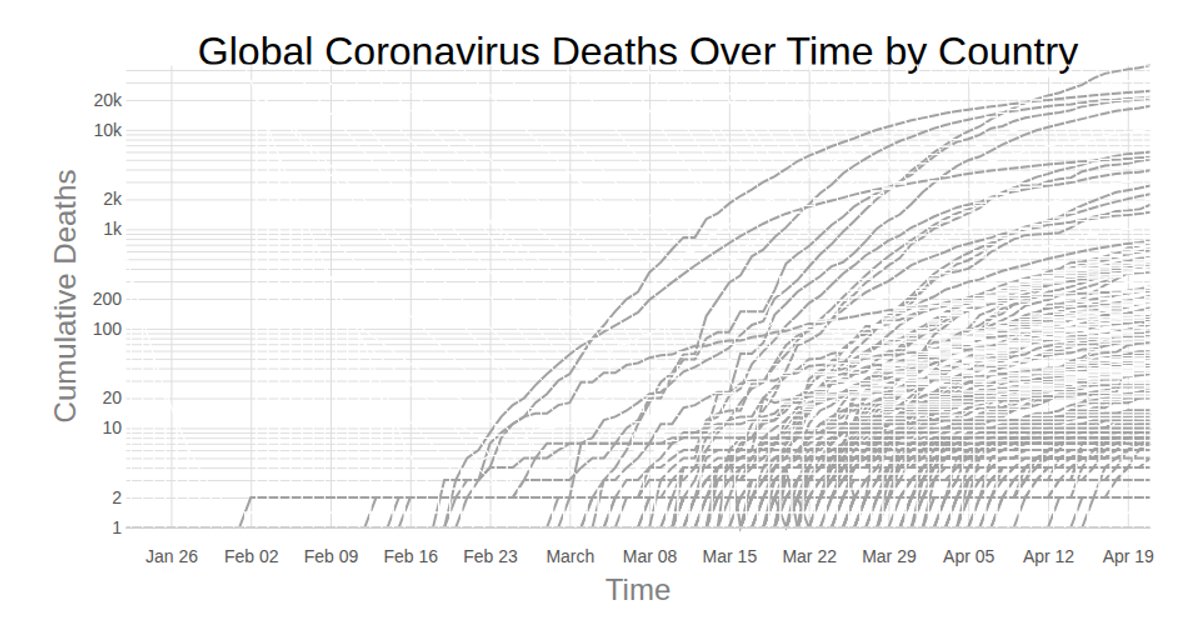
Log-scaled line chart displays cumulative COVID-19 deaths over time for each country, sourced from the Johns Hopkins dataset. A Voronoi overlay, computed with `d3.Delaunay`, creates hover regions around each data point, triggering a highlighted stroke on the corresponding country line. React manages the interactive state, while D3’s `scaleLog`, `line`, and `axisBottom`/`axisLeft` render the SVG visualization.
AI-generated descriptionLine chart of Coronavirus cases to date. Data from Johns Hopkins Coronavirus Dataset.
MIT Licensed




Comments
Sign in to join the discussion.